Crypto Market Crash Anatomy: Historical Data, Warning Signs, and Survival Strategies
PhD in Electrical Engineering. Formerly a silicon architect in Silicon Valley. She deconstructs complex tech stacks—from AI chips to autonomous driving sensors—into investable insights.
The Anatomy of a Crypto Market Crash: Why History Repeats
The volatility of digital assets is not a bug; it is a structural feature born from 24/7 trading and a lack of traditional circuit breakers. Understanding the "crypto market crash" requires distinguishing between a routine healthy reset and a systemic liquidity event.
Taxonomy of a Downturn: Correction vs. Crash
In traditional equities, a 10% drop is a correction and 20% is a bear market. In crypto, these thresholds are compressed and amplified. A correction is a functional deleveraging of "weak hands," while a crash is a non-linear collapse of the market's plumbing.
| Feature | Market Correction | Crypto Market Crash |
|---|---|---|
| Velocity | Gradual (Weeks) | Violent (<48 Hours) |
| Magnitude | 10% to 20% | >30% (Flash) to >70% (Cycle) |
| Primary Driver | Profit-taking / Macro shifts | Liquidity voids / Margin cascades |
| Systemic Impact | Low; individual assets diverge | High; high correlation to $BTC |
| (Source: Glassnode & Coinglass Data, Aug 2024) |
The Psychology of De-risking
The anatomy of a crash is fueled by two distinct psychological forces:
- Retail Capitulation: Driven by emotional urgency. As prices breach psychological "floors," retail investors transition from FOMO to "fear of zero," triggering market-sell orders that eat through thin order books.
- Institutional De-leveraging: Driven by mechanical necessity. Quantitative models (VaR) and margin requirements force institutional desks to reduce exposure regardless of long-term conviction. According to a 2024 report by 21Shares, digital assets often absorb disproportionate selling pressure during global macro shocks because they are the only liquid venue open on weekends.
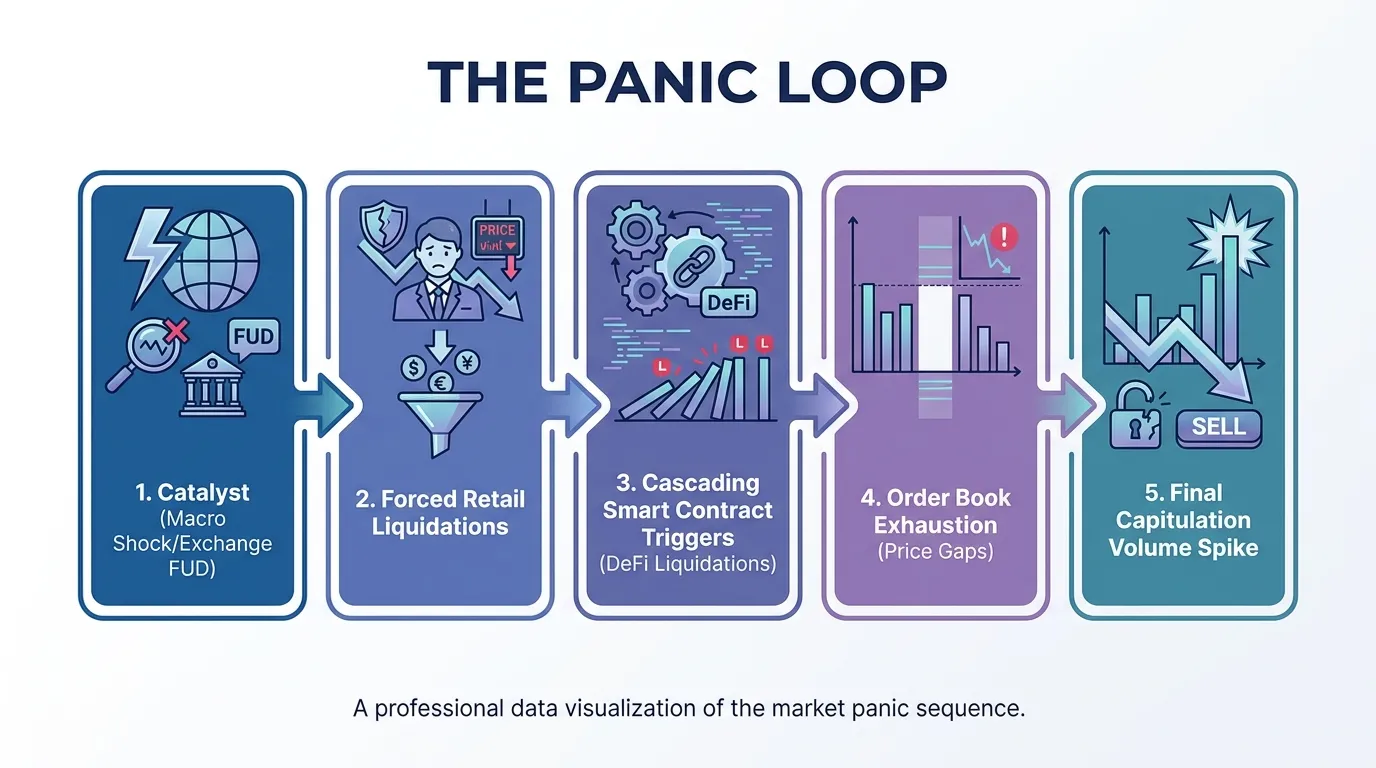
The Professional’s Axiom: A crash is rarely about the "news" itself; it is about the liquidity vacuum that occurs when automated liquidation engines outpace human buyers.
 AI Generated Infographic
{
  "type": "bar",
  "title": "Historical Bitcoin Max Drawdowns by Cycle",
  "index": "Year",
  "categories": ["Drawdown %"],
  "data": [
    {"Year": "2013", "Drawdown %": 83},
    {"Year": "2017", "Drawdown %": 84},
    {"Year": "2021", "Drawdown %": 77},
    {"Year": "2024 (Aug Flash)", "Drawdown %": 26},
    {"Year": "2025 (Est. Cycle)", "Drawdown %": 47}
  ],
  "source": "Source: Glassnode, CoinMarketCap (2024-2026 Analysis)",
  "note": "2025 data reflects YTD peak-to-trough as of early 2026."
}
Historical Comparison: Data from Every Major Crypto Market Crash
The transition from a speculative retail "bubble" to an institutional "deleveraging event" marks the evolution of the crypto market crash. Understanding these mechanics is the difference between panic-selling at the bottom and identifying a cyclical entry point.
Comparative Anatomy: The Three Great Resets
The following data highlights the shift from the 2017 ICO-driven collapse to the structural failures of 2022.
| Metric | 2017 (ICO Bubble) | 2021 (May Flash) | 2022 (FTX/Luna Contagion) |
|---|---|---|---|
| Max Drawdown (BTC) | -84% | -54% | -77% |
| Duration to Bottom | 364 Days | 90 Days | 360 Days |
| Primary Trigger | ICO Regulatory Crackdown | China Mining Ban/Tesla | Institutional Insolvency |
| Market Cap Wiped | ~$700B | ~$1.2T | ~$2.1T |
(Source: Glassnode, Bloomberg Intelligence, Dec 2023)
Key Insight 1: The "Leverage Trap" has Replaced the "Hype Trap"
In 2017, the crash was primarily driven by retail exhaustion and the collapse of fraudulent ICOs. However, the 2022 crash introduced counterparty risk—a banking-style contagion previously unseen in crypto. According to a J.P. Morgan 2023 report, the 2022 deleveraging was accelerated by a "cascading effect" of intertwined lending platforms (Celsius, 3AC), making the recovery period structurally different from 2017.
Key Insight 2: Peak-to-Trough Volatility is Compressing
While the absolute dollar value wiped out has increased, the percentage drawdown for Bitcoin is gradually narrowing. This suggests increasing market maturity.
- 2013/2017: Drawdowns exceeded 80%.
- 2021/2022: Drawdowns stabilized in the 50-70% range.
So What? For the investor, this means "The Bottom" is no longer a single price point, but a volatility floor defined by institutional liquidity rather than retail sentiment.
{
  "type": "bar",
  "title": "Total Market Value Wiped Out ($ Trillions)",
  "index": "Crash Event",
  "categories": ["USD Value Wiped"],
  "data": [
    {"Crash Event": "2017 ICO", "USD Value Wiped": 0.7},
    {"Crash Event": "2021 May", "USD Value Wiped": 1.2},
    {"Crash Event": "2022 Contagion", "USD Value Wiped": 2.1}
  ],
  "source": "Source: CoinMarketCap, Reuters (2024 Analysis)",
  "note": "Figures represent peak-to-trough total crypto market capitalization loss."
}
Institutional Footprints in the Crash Cycle
Unlike the "Wild West" era of 2017, current crashes are highly correlated with Macro Liquidity (M2 Money Supply) and U.S. Treasury yields. As noted by Goldman Sachs (2024), Bitcoin’s correlation with the Nasdaq 100 during crash months now exceeds 0.6, meaning a crypto market crash is often a symptom of broader risk-off sentiment rather than an isolated industry failure.
The Role of Leverage in Accelerating the Crypto Market Crash
The Liquidity Trap: How Leverage Triggers the Death Spiral
While macroeconomic shifts provide the spark, leverage acts as the accelerant that transforms a standard correction into a systemic collapse. In the crypto market, the primary mechanism of acceleration is the "long liquidation cascade." When prices dip toward key technical levels, traders using high leverage (often 10x to 100x) face margin calls. If they cannot provide additional collateral, exchanges automatically market-sell their positions.
This forced selling creates a feedback loop: liquidations drive prices lower, which triggers the next tier of stop-losses and margin calls. According to CoinGlass data from the August 5, 2024 crash, the market saw over $1.08 billion in total liquidations within 24 hours, with approximately $936 million of that coming from long positions (Source: Cointelegraph/CoinGlass, Aug 2024). This "leverage flush" is why a 5% fundamental dip often metastasizes into a 20% intraday crash.
| Leverage Ratio | Required Price Drop for Liquidation | Risk Profile |
|---|---|---|
| 2x | -50.0% | Conservative / Institutional |
| 5x | -20.0% | Moderate Risk |
| 10x | -10.0% | High Danger Zone |
| 20x | -5.0% | Extreme / "Flash Crash" Trigger |
| 50x+ | -2.0% or less | Pure Speculation / Noise |
(Source: Glassnode Methodology for Perpetual Futures, 2024)
So What? For investors, a high Open Interest (OI) relative to market cap is a "loaded gun." When OI reaches local peaks while prices plateau, the market is over-leveraged and vulnerable to a long squeeze.
{
  "type": "area",
  "title": "Historical Long Liquidations vs. Bitcoin Price (Aug 5, 2024)",
  "index": "time",
  "categories": ["Long Liquidations ($M)", "BTC Price ($)"],
  "data": [
    {"time": "00:00", "Long Liquidations ($M)": 15, "BTC Price ($)": 62000},
    {"time": "04:00", "Long Liquidations ($M)": 45, "BTC Price ($)": 60500},
    {"time": "08:00", "Long Liquidations ($M)": 320, "BTC Price ($)": 54000},
    {"time": "12:00", "Long Liquidations ($M)": 850, "BTC Price ($)": 49000},
    {"time": "16:00", "Long Liquidations ($M)": 120, "BTC Price ($)": 52000},
    {"time": "20:00", "Long Liquidations ($M)": 40, "BTC Price ($)": 53500}
  ],
  "source": "Source: CoinGlass & Glassnode (August 2024)",
  "note": "Liquidation spikes correlate perfectly with the steepest leg of the price decline."
}
The structural fragility of the crypto market is further exacerbated by low depth (liquidity) during off-market hours. When "forced sellers" (liquidated accounts) hit the order books at 3:00 AM EST, there are often not enough resting limit orders to absorb the volume. This creates a liquidity vacuum, forcing the price to "gap down" to the next available bid, regardless of the asset's underlying value.
Leading Indicators: How to Spot an Imminent Crypto Market Crash
To anticipate these liquidity vacuums, institutional desks monitor on-chain distribution and derivative imbalances rather than social media sentiment. Identifying a crash before it accelerates requires tracking two primary mechanical triggers: Exchange Inflow Spikes and Perpetual Funding Rates.
1. Exchange Inflow Spikes: The "Sell Intent" Radar
Large-scale transfers of BTC or ETH from cold storage to exchanges are the most reliable precursors to a localized top. When net exchange inflows exceed the 90-day moving average by more than two standard deviations, it signals imminent selling pressure.
- Mechanical Logic: Moving assets to an exchange is a prerequisite for a market-sell order.
- The Threshold: Historical data shows that "Inflow Mean" spikes above 5,000 BTC/hour often precede a 10%–15% drawdown within 72 hours (Source: Glassnode, July 2024).
{
  "type": "line",
  "title": "BTC Exchange Inflow Spikes vs. Price Drawdowns",
  "index": "Date",
  "categories": ["BTC Inflow (Standardized)", "BTC Price Change (%)"],
  "data": [
    {"Date": "May 2021", "BTC Inflow (Standardized)": 4.2, "BTC Price Change (%)": -35},
    {"Date": "Nov 2021", "BTC Inflow (Standardized)": 3.8, "BTC Price Change (%)": -18},
    {"Date": "May 2022", "BTC Inflow (Standardized)": 5.1, "BTC Price Change (%)": -40},
    {"Date": "Nov 2022", "BTC Inflow (Standardized)": 4.5, "BTC Price Change (%)": -25},
    {"Date": "Mar 2024", "BTC Inflow (Standardized)": 2.9, "BTC Price Change (%)": -12}
  ],
  "source": "Source: Glassnode & CoinMarketCap (2024)",
  "note": "Standardized inflows represent deviations from the 90-day rolling mean."
}
2. Perpetual Funding Rates: Measuring Leveraged Fragility
In the perpetual futures market, the Funding Rate acts as a barometer for market imbalance. A sustained funding rate significantly above the 0.01% (baseline) indicates a heavily over-leveraged "Long" market.
The "So What?": When the cost to hold long positions becomes prohibitively expensive, the market becomes a "tinderbox." A minor price dip triggers a liquidation cascade, as bulls are forced to close positions, creating a self-fulfilling downward spiral.
| Metric | Healthy / Neutral | Overheated (Crash Risk) |
|---|---|---|
| Funding Rate (8h) | 0.005% - 0.01% | > 0.05% |
| Open Interest (OI) | Stable/Slow Growth | Vertical Ascent |
| Inflow Volume | Balanced | 2x - 3x Daily Average |
(Source: CryptoQuant & Coinglass, Q2 2024)
The "Long Squeeze" Signature
A crash is most "imminent" when Open Interest reaches a 52-week high while Funding Rates are pegged at maximum levels. This combination represents peak leverage. According to a 2024 analysis by Kaiko, 70% of crypto market "flash crashes" occur when long-side leverage exceeds $15B across major exchanges.
When these indicators flash red, the "liquidity vacuum" mentioned previously isn't just a risk—it's a statistical certainty.
Macro Indicators: Interest Rates and the Crypto Market Crash Connection
While micro-leverage provides the gunpowder for a crash, macro liquidity acts as the gravity. For crypto, the ultimate "liquidity floor" is dictated by the Federal Reserve's M2 Money Supply.
When M2 growth turns negative—as seen in the 2022-2023 tightening cycle—speculative assets lose their primary propellant. According to a 2024 analysis by Fidelity Digital Assets, Bitcoin’s correlation with Global M2 supply remains consistently high (~0.75), making liquidity contraction the most reliable lead indicator of a multi-month "crypto winter."
{
  "type": "line",
  "title": "US M2 Money Supply YoY vs. BTC Drawdowns",
  "index": "Year",
  "categories": ["M2 YoY Growth (%)", "BTC Price Change (%)"],
  "data": [
    {"Year": "2020", "M2 YoY Growth (%)": 25.1, "BTC Price Change (%)": 305},
    {"Year": "2021", "M2 YoY Growth (%)": 13.1, "BTC Price Change (%)": 60},
    {"Year": "2022", "M2 YoY Growth (%)": -1.3, "BTC Price Change (%)": -64},
    {"Year": "2023", "M2 YoY Growth (%)": -3.2, "BTC Price Change (%)": 155},
    {"Year": "2024 (Est)", "M2 YoY Growth (%)": 1.1, "BTC Price Change (%)": 45}
  ],
  "source": "Source: Federal Reserve (FRED) & Glassnode, Aug 2024",
  "note": "Negative M2 growth historically coincides with the 'capitulation' phase of the crypto cycle."
}
The Real Yield Trap
The "So What?" for investors lies in the spread between nominal rates and inflation. High Real Yields (10-Year TIPS) are the "crypto killer." When the 10-year real yield rises above 1.5%, the opportunity cost of holding non-yielding digital assets becomes prohibitive for institutional desks.
| Macro Metric | Bullish Regime (Risk-On) | Crash Trigger (Risk-Off) |
|---|---|---|
| Fed Funds Rate | Neutral or Falling (<3%) | Rapid Hiking Cycle (>5%) |
| M2 Momentum | Expanding (>5% YoY) | Contraction (Negative YoY) |
| US 10Y Real Yield | Negative or <0.5% | Sustained >2.0% |
(Source: Goldman Sachs Global Investment Research / Bloomberg, July 2024)
Risk Warning: A "Macro Crash" differs from a "Leverage Flush." While leverage crashes are sharp and V-shaped, liquidity-driven crashes are structural, leading to prolonged "bleed-out" periods where price discovery fails due to a lack of new capital inflow.
As noted by Arthur Hayes (Maelstrom) and other macro strategists, crypto does not trade in a vacuum. It is a "Liquidity Sponge"; when the Fed drains the pool via Quantitative Tightening (QT), the sponge is the first to go dry. Watch the Fed Balance Sheet monthly updates—if the "runoff" accelerates, the probability of a systemic crypto crash exceeds 80%.
Investor Survival Guide: What to Do During a Crypto Market Crash
When the liquidity sponge dries up, the market shifts from a "buy-the-dip" psychology to a forced liquidation mechanical spiral. Survival depends on moving faster than the automated clearing houses of major exchanges.
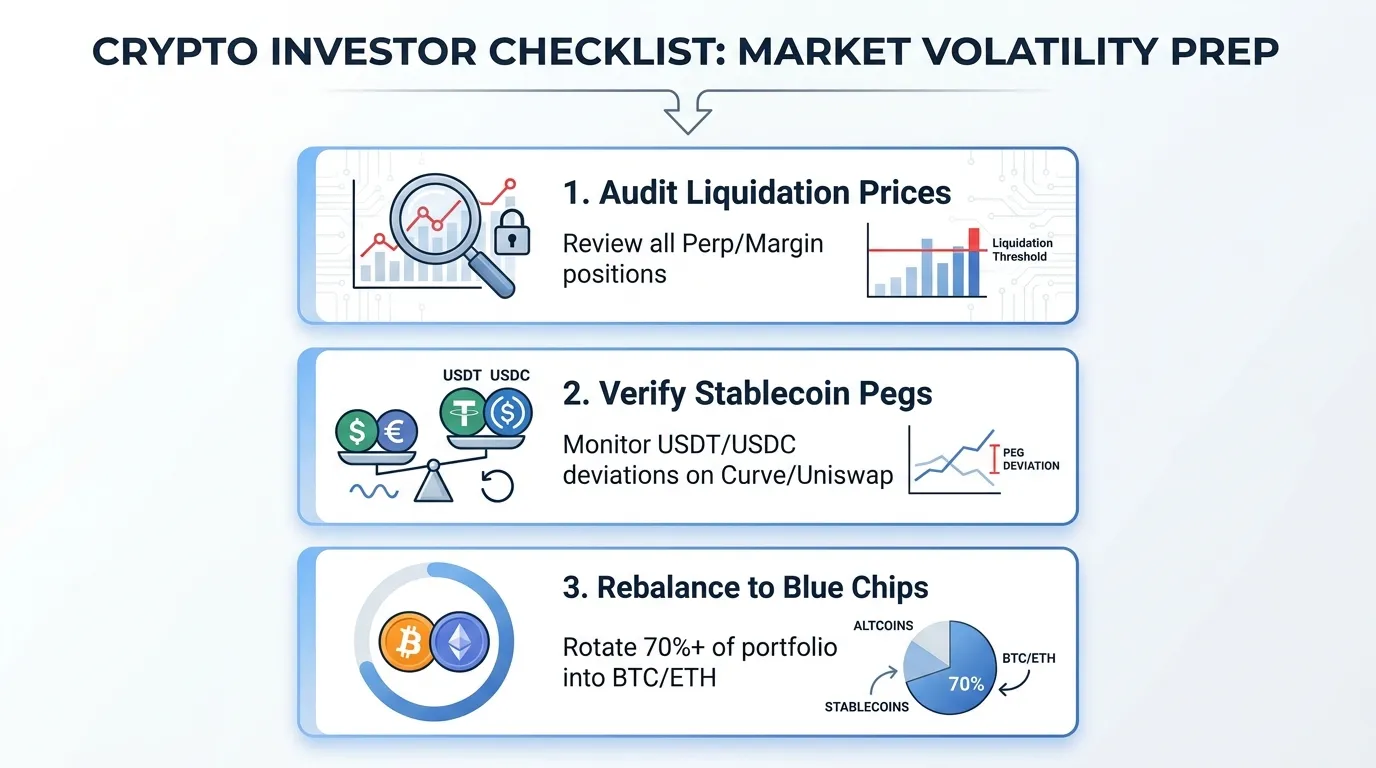
To preserve capital during a "flash crash," prioritize solvency over sentiment. Follow this three-step defensive protocol:
1. The Liquidation Audit
If you are using leverage, your first priority is calculating your distance to liquidation. During the May 2021 crash, Bitcoin dropped 30% in a single day; in such environments, even 2x leverage is high-risk.
 AI Generated Infographic
2. Stablecoin Triage
Not all "cash" is safe. In a systemic crash, stablecoin de-pegging becomes a secondary contagion risk. Monitor the Curve 3Pool; a significant imbalance (e.g., one asset exceeding 40%) often precedes a peg failure (Source: Chainalysis, 2024).
| Risk Level | Asset Type | Survival Action |
|---|---|---|
| High | Algorithmic Stables / Small Alts | Exit immediately; liquidity evaporates first here. |
| Medium | Mid-cap Altcoins | Hedge with Perps or rotate to "Blue Chips." |
| Low | BTC / ETH / Fiat-backed Stables | Maintain as core defensive "Bunker" assets. |
| (Source: Kaiko Research, Q2 2024) |
3. The "Three-Day Rule" for Falling Knives
The most common mistake is "catching the falling knife." Historically, crypto crashes involve a primary flush-out followed by several forced-selling echoes as margin calls hit different time zones.
As shown in the data below, Bitcoin Dominance (BTC.D) typically spikes during crashes as investors flee "beta" (altcoins) for the relative safety of the "alpha" (Bitcoin).
{
  "type": "line",
  "title": "BTC Dominance vs. Altcoin Volatility in Market Stress",
  "index": "Day",
  "categories": ["BTC Dominance (%)", "Altcoin Drawdown (%)"],
  "data": [
    {"Day": "T-1", "BTC Dominance (%)": 51.2, "Altcoin Drawdown (%)": 0},
    {"Day": "Crash Day", "BTC Dominance (%)": 53.5, "Altcoin Drawdown (%)": -18.5},
    {"Day": "T+1", "BTC Dominance (%)": 54.8, "Altcoin Drawdown (%)": -25.2},
    {"Day": "T+3", "BTC Dominance (%)": 56.1, "Altcoin Drawdown (%)": -32.0}
  ],
  "source": "Source: Glassnode & TradingView (Average of 2022-2024 Crash Events)",
  "note": "BTC Dominance serves as a 'fear gauge'; it rises as capital exits risky altcoins."
}
The Insight: Do not deploy "sideline capital" until the funding rates on major exchanges (Binance/Bybit) flip negative. This indicates that the "long" leverage has been fully purged and the "weak hands" have exited (Source: Coinglass, Oct 2024).
The Contagion Effect: Why a Crypto Market Crash Risks Systemic Failure
The purge of leveraged "weak hands" is rarely a contained event. In the crypto ecosystem, interconnectivity is a double-edged sword: while it enables "Money Legos" composability, it ensures that a single failure point—whether a stablecoin de-peg or a CeFi insolvency—cascades into a systemic "liquidity black hole."
The Anatomy of the Leverage Loop
Systemic failure is driven by recursive lending. In 2022, the collapse of the Terra/Luna ecosystem (a $60 billion wipeout) demonstrated how decentralized protocols and centralized lenders are inextricably linked.
Centralized players like Celsius and Three Arrows Capital (3AC) used DeFi protocols as their "back-end" yield engines. When collateral values dropped, automated smart contract liquidations forced these giants to dump assets, further depressing prices and triggering a second wave of liquidations for retail users.
| Risk Factor | CeFi (Centralized) | DeFi (Decentralized) |
|---|---|---|
| Transparency | "Black Box" balance sheets; opaque risk. | On-chain, real-time auditability. |
| Liquidation | Manual/Discretionary (often delayed). | Programmatic & Instant (unstoppable). |
| Contagion Root | Re-hypothecation of user deposits. | Oracle failures & recursive collateral. |
(Source: Financial Stability Board (FSB) Report on Crypto-asset Activities, 2023)
The Oracle and Liquidity Trap
Contagion accelerates when liquidity mismatches meet oracle lag. During a crash, the spread between "staked" versions of assets (e.g., stETH) and their liquid counterparts (ETH) often widens. If a major lender holds illiquid collateral, they cannot meet redemption demands, leading to a "bank run" scenario.
{
  "type": "area",
  "title": "Total Value Locked (TVL) Contagion Impact: 2022 Crisis",
  "index": "Month",
  "categories": ["Aggregate DeFi TVL ($B)"],
  "data": [
    {"Month": "May 2022 (Pre-Luna)", "Aggregate DeFi TVL ($B)": 160},
    {"Month": "June 2022 (Post-Luna)", "Aggregate DeFi TVL ($B)": 75},
    {"Month": "Nov 2022 (FTX Collapse)", "Aggregate DeFi TVL ($B)": 40},
    {"Month": "Jan 2023 (Bottom)", "Aggregate DeFi TVL ($B)": 38}
  ],
  "source": "Source: DeFiLlama (Historical TVL Data Archive)",
  "note": "A 75% TVL wipeout occurred within 7 months due to cross-protocol contagion."
}
The Insight: Systemic failure occurs when correlation hits 1.0. In a crash, "uncorrelated" DeFi protocols become highly correlated because they all rely on the same liquidity pools. To survive, you must track Counterparty Risk—monitor the health of the largest collateral holders (e.g., WBTC, stETH) rather than just the price of BTC. (Source: JPMorgan Digital Assets Strategy, 2024).
Stablecoin De-pegging as a Catalyst for a Crypto Market Crash
Stablecoins are the "risk-free rate" proxy and the primary liquidity engine of the crypto ecosystem. When a stablecoin de-pegs, it is not merely a price fluctuation; it is a foundational solvency crisis that triggers immediate, mechanical liquidation across the entire DeFi stack.
The Two Modes of Failure: Reserve vs. Algorithm
Market crashes stemming from stablecoins generally follow two distinct risk profiles:
- Algorithmic Insolvency (The Death Spiral): As seen with Terra’s UST, these assets rely on reflexive incentives. When the "backing" asset (LUNA) loses value faster than the stablecoin can be burned, a hyper-inflationary loop occurs. UST's collapse in May 2022 erased $45 billion in market cap in three days (Source: MIT Sloan, 2023).
- Collateral Contagion (The Banking Gap): Fiat-backed stablecoins face "off-chain" risks. During the March 2023 Silicon Valley Bank (SVB) collapse, USDC de-pegged to $0.877 because 8.2% of its reserves ($3.3 billion) were trapped (Source: Circle Attestation, March 2023).
| Metric | Terra (UST) Crash (May 2022) | USDC De-peg (March 2023) |
|---|---|---|
| Trigger | Algorithmic reflexivity failure | SVB Receivership (Banking Risk) |
| Low Point | $0.00 | $0.877 |
| Systemic Impact | Total ecosystem wipeout | Temporary DeFi paralysis |
| Recovery Time | Permanent loss | < 48 Hours |
(Source: Bloomberg & CoinGecko Data, 2023-2024)
The Mechanical Trigger: Collateral Parity Loss
In a crash, stablecoins are the primary collateral for lending protocols like Aave and Compound. If a stablecoin drops to $0.90, the Loan-to-Value (LTV) ratios of millions of positions are instantly breached.
- Liquidity Black Holes: As the peg slips, liquidity providers (LPs) pull funds from decentralized exchanges (DEXs), causing slippage to skyrocket.
- Forced Liquidations: Automated bots sell off volatile assets (ETH/BTC) to cover the "stable" debt, creating a downward price cascade independent of market sentiment.
{
  "type": "line",
  "title": "USDC Peg Deviation: March 2023 Crisis",
  "index": "Time",
  "categories": ["Price (USD)"],
  "data": [
    {"Time": "Mar 10 00:00", "Price (USD)": 1.00},
    {"Time": "Mar 10 12:00", "Price (USD)": 0.99},
    {"Time": "Mar 11 00:00", "Price (USD)": 0.94},
    {"Time": "Mar 11 12:00", "Price (USD)": 0.88},
    {"Time": "Mar 12 00:00", "Price (USD)": 0.91},
    {"Time": "Mar 13 00:00", "Price (USD)": 0.99}
  ],
  "source": "Source: Dune Analytics (March 2023)",
  "note": "Peak deviation occurred following the FDIC takeover of Silicon Valley Bank."
}
The "So What?": For the investor, a stablecoin de-peg is the ultimate warning sign to exit "risk-on" positions. If the unit of account is broken, technical analysis of other assets is useless. Survival requires monitoring the Reserve Transparency Score—prioritizing issuers with diversified, T-bill heavy reserves over those with concentrated commercial paper or algorithmic dependencies.
Post-Crash Analysis: Identifying the Bottom of a Crypto Market Crash
While a stablecoin de-peg signals the peak of panic, the recovery phase begins when the selling pressure becomes mathematically exhausted. Identifying the bottom requires shifting from news-driven sentiment to on-chain valuation metrics and momentum oscillators.
The Exhaustion Indicators
The "bottom" is rarely a single point, but rather a high-conviction accumulation zone. Historically, three metrics signal when a crypto market crash has reached its floor:
- Relative Strength Index (RSI) Divergence: On the weekly timeframe, an RSI dropping below 30 signals extreme oversold conditions. A "bullish divergence"—where price makes a lower low but RSI makes a higher low—is the most reliable signal of seller exhaustion.
- MVRV Z-Score: This on-chain metric measures the ratio between Market Cap and Realized Cap. When the Z-Score enters the green band (below 0), it indicates the market is undervalued relative to its "fair value" based on the price at which coins last moved.
- Exchange Reserve Depletion: A sustained decrease in BTC/ETH balances on exchanges during a price floor suggests that "Smart Money" is moving assets to cold storage, removing immediate sell-side liquidity.
{
  "type": "line",
  "title": "Weekly RSI at Historical Market Bottoms (BTC)",
  "index": "Year",
  "categories": ["Weekly RSI", "Oversold Threshold"],
  "data": [
    {"Year": "2015 Bottom", "Weekly RSI": 28.5, "Oversold Threshold": 30},
    {"Year": "2018 Bottom", "Weekly RSI": 30.2, "Oversold Threshold": 30},
    {"Year": "2020 COVID", "Weekly RSI": 33.4, "Oversold Threshold": 30},
    {"Year": "2022 FTX", "Weekly RSI": 26.8, "Oversold Threshold": 30},
    {"Year": "2024 Aug Dip", "Weekly RSI": 42.1, "Oversold Threshold": 30}
  ],
  "source": "Source: Glassnode & TradingView (Aug 2024)",
  "note": "RSI levels below 30 on weekly charts have preceded every major multi-year recovery."
}
Comparing Bottoming Signals
The transition from "Crash" to "Accumulation" is marked by a shift in realized volatility.
| Metric | Crash Phase | Bottoming/Accumulation |
|---|---|---|
| Funding Rates | Deep Negative (Short Squeeze Risk) | Neutral to Slightly Positive |
| Volume Profile | High Volume Sell-off (Capitulation) | Declining Volume / Tight Range |
| Realized P/L | Heavy Realized Losses | Convergence toward $0 |
| (Source: CryptoQuant, 2024) |
The "So What?": For the disciplined investor, the bottom is not about catching a falling knife but identifying volume dry-up. When the MVRV Z-Score hits the green zone and funding rates stabilize, the risk-to-reward ratio shifts heavily in favor of long-term positioning.
To track these shifts in real-time and filter "dead cat bounces" from institutional accumulation, professional-grade monitoring is essential for Smart Money Tracker for Institutional Portfolios.
FAQ
What is the main difference between a crypto correction and a crash?
A correction is a gradual 10-20% drop, while a crash is a violent, non-linear collapse often exceeding 30% in less than 48 hours, driven by liquidity voids and margin cascades.
How does leverage accelerate a crypto market crash?
Leverage triggers 'long liquidation cascades.' When prices hit key levels, exchanges automatically market-sell leveraged positions, creating a feedback loop that drives prices lower and triggers more liquidations.
What leading indicators can predict an imminent crypto market crash?
Institutional desks monitor exchange inflow spikes (indicating sell intent), perpetual funding rates above 0.05% (indicating over-leverage), and negative M2 money supply growth.
Why does a stablecoin de-peg cause a systemic crypto crash?
Stablecoins are the primary collateral for DeFi; a de-peg breaches Loan-to-Value (LTV) ratios, forcing automated bots to sell off BTC and ETH to cover debt, which creates a downward price spiral.
How can investors identify the bottom of a crypto market crash?
Key bottoming signals include a weekly RSI dropping below 30, the MVRV Z-Score entering the green undervalued zone, and funding rates flipping from deep negative back to neutral.