7 Best Copper Mining Stocks to Buy in 2026: A Strategy-First Investment Guide
Specializes in alternative data and valuation models. Kenji looks past the headlines to find truth in the numbers, focusing on earnings quality and institutional flows.
The Investment Case for Copper Mining Stocks to Buy in 2026
The era of copper as a cyclical industrial metal is over; it has officially transitioned into a strategic tech-commodity. As we enter 2026, the market is grappling with a structural "double-squeeze" where traditional electrical demand is being outpaced by the massive copper intensity of AI data centers and global grid modernization.
According to a June 2026 report by Goldman Sachs, the global copper market has shifted from a multi-year surplus to a persistent structural deficit. While the International Copper Study Group (ICSG) initially projected a surplus for 2026, recent disruptions at tier-one operations like Grasberg (Indonesia) and Kamoa-Kakula (DRC) have forced analysts to revise forecasts toward a 150,000 to 330,000-metric-ton shortfall.
The Multi-Front Demand Surge
The investment urgency in 2026 is driven by three non-negotiable demand pillars that are insensitive to short-term interest rate fluctuations:
| Sector | Copper Intensity Impact | 2026-2030 CAGR Est. |
|---|---|---|
| AI Data Centers | 5–15 tons per MW (3x traditional) | 25% - 30% |
| Grid Infrastructure | Massive upgrades for renewable integration | 12% |
| Electric Vehicles | 80kg+ per vehicle vs. 20kg for ICE | 18% |
(Source: McKinsey Global Materials Perspective 2025; J.P. Morgan Research 2026)
{
  "type": "line",
  "title": "Global Copper Supply-Demand Gap (2024-2030)",
  "index": "year",
  "categories": ["Refined Demand (Mt)", "Mine Production (Mt)"],
  "data": [
    {"year": "2024", "Refined Demand (Mt)": 26.5, "Mine Production (Mt)": 26.2},
    {"year": "2025", "Refined Demand (Mt)": 27.8, "Mine Production (Mt)": 27.0},
    {"year": "2026", "Refined Demand (Mt)": 29.2, "Mine Production (Mt)": 28.1},
    {"year": "2027", "Refined Demand (Mt)": 31.0, "Mine Production (Mt)": 29.0},
    {"year": "2028", "Refined Demand (Mt)": 33.1, "Mine Production (Mt)": 29.8},
    {"year": "2029", "Refined Demand (Mt)": 35.4, "Mine Production (Mt)": 30.5},
    {"year": "2030", "Refined Demand (Mt)": 38.0, "Mine Production (Mt)": 31.2}
  ],
  "source": "Source: Wood Mackenzie & Goldman Sachs Global Investment Research (2026 projections)",
  "note": "Projection assumes current 'committed' projects only; does not include unfinanced greenfield mines."
}
The "So What?": Why 2026 is the Entry Point
For investors, the supply side is the bottleneck. The average lead time from discovery to production has ballooned to 17 years (Source: IEA, 2026). With LME copper prices averaging over $12,500/ton in early 2026, the focus has shifted from "if" prices will rise to "who" can produce it profitably.
Investor Insight: The market is now pricing in a "scarcity premium." Stocks with an All-In Sustaining Cost (AISC) below $2.50/lb are currently printing cash at record levels, providing a massive buffer for our Barbell Strategy.
Identifying which copper mining stocks to buy now is about capturing the spread between record spot prices and stable production costs before the next supply cliff in 2027.
Impact of Geopolitical Disruptions on Copper Stock Valuations
Geopolitical volatility is the ultimate catalyst for the "Barbell Strategy," separating companies with operational resilience from those vulnerable to supply chain chokepoints.
When strategic corridors like the Strait of Hormuz face closure—as seen in recent escalations—the impact on copper is two-pronged: a surge in energy-driven AISC and a flight to Tier-1 jurisdictional safety.
The "Security Premium" Decoupling
Global disruptions create "buy the dip" opportunities by mispricing stocks based on temporary logistics rather than long-term asset quality.
- Logistics vs. Geology: A transit blockage spikes freight and fuel costs, hitting high-AISC miners in remote regions hardest.
- The Opportunity: Deep sell-offs in low-cost producers located in North America or Australia are often irrational. These "safe-haven" miners benefit from higher spot prices without the same maritime risk exposure.
Investor Insight: During peak geopolitical tension, the market often discounts all copper miners equally. This is a mistake. Focus on companies with domestic smelting access or short, land-based supply chains to capture the rebound.
{
  "type": "bar",
  "title": "AISC Sensitivity to $10/bbl Oil Price Spike",
  "index": "Mining Region",
  "categories": ["OPEX Increase (%)"],
  "data": [
    {"Mining Region": "Tier-1 (USA/Canada)", "OPEX Increase (%)": 3.2},
    {"Mining Region": "Tier-2 (Chile/Peru)", "OPEX Increase (%)": 5.8},
    {"Mining Region": "Tier-3 (DRC/Zambia)", "OPEX Increase (%)": 9.4}
  ],
  "source": "Source: Wood Mackenzie, Goldman Sachs Research (2024)",
  "note": "Higher energy costs disproportionately impact miners in regions with poor infrastructure and long-haul logistics."
}
Strategic Rebalancing: Transit Risk vs. Resource Nationalism
To execute a successful "buy the dip" entry, investors must distinguish between temporary transit shocks (bullish for price) and structural jurisdictional shifts (bearish for valuation).
| Disruption Type | Immediate Market Impact | Strategy-First Action |
|---|---|---|
| Chokepoint Closure (e.g., Hormuz, Suez) | Spot price spike; AISC inflation. | Buy the Dip on low-AISC Tier-1 miners. |
| Tax/Royalty Hikes (e.g., Panama, Chile) | Valuation multiple contraction. | Avoid until fiscal stability is legislated. |
| Grid Instability (e.g., South Africa, Zambia) | Production guidance downgrades. | Short high-cost, energy-dependent miners. |
(Source: S&P Global Market Intelligence, 2024)
As of Q3 2024, Goldman Sachs projects a copper deficit of nearly 500,000 tons by 2026. Geopolitical disruptions don't just reduce supply; they accelerate the "Scarcity Premium."
Investors should prioritize stocks with an AISC below $2.50/lb and a Jurisdictional Risk Score below 3.0 (Fraser Institute scale). These assets provide the necessary margin to absorb energy spikes while trading at a premium as "critical mineral security" becomes a national priority.
Top Tier-1 Copper Mining Stocks to Buy for Defensive Stability
For conservative investors, the "Barbell Strategy" starts with Tier-1 Margin Kings. These are operators with massive scale and low-cost curves that transform copper’s price volatility into predictable cash flow.
In a "Higher-for-Longer" cost environment, Southern Copper (SCCO) and Freeport-McMoRan (FCX) serve as defensive anchors. Their primary advantage is not just production volume, but the ability to maintain Operating Margins above 35% even if copper retreats to $3.50/lb.
The Defensive Benchmarks: Tier-1 Comparison
| Ticker | AISC (Net of By-products) | Operating Margin | Div. Yield (TTM) | Primary Jurisdictions |
|---|---|---|---|---|
| SCCO | ~$1.10 - $1.25/lb | 48.5% | 3.8% - 4.5% | Peru, Mexico |
| FCX | ~$1.55 - $1.65/lb | 36.2% | 0.7% + Variable | USA, Indonesia |
| BHP | ~$1.40 - $1.50/lb | 41.0% | 5.1% | Chile, Australia |
(Source: Company 10-K Filings & Bloomberg Intelligence, Oct 2024. Note: AISC estimates for FY 2025/2026 based on consensus commodity pricing.)
1. Southern Copper (SCCO): The Industry’s Cost Floor
SCCO owns the largest copper reserves of any publicly traded company. Its All-In Sustaining Cost (AISC) is consistently the lowest globally, driven by high-grade open-pit mines and significant molybdenum/silver by-product credits.
- So What? SCCO can survive a price collapse that would bankrupt mid-tier miners. It is a "pure play" on copper with a payout ratio that historically favors aggressive dividends over speculative M&A.
- Risk Note: High exposure to Peruvian political shifts is the "tax" you pay for the world’s best margins.
2. Freeport-McMoRan (FCX): The Operational Scale Compounder
Freeport has transitioned from a high-debt miner to a free cash flow machine. Its 2024-2026 strategy focuses on "Leach Innovation"—extracting copper from waste rock using new technologies, which adds production without the CAPEX of a new mine.
- Key Insight: FCX’s Grasberg mine (Indonesia) is now fully underground and optimized. Goldman Sachs (2024) notes that FCX is best positioned to benefit from U.S. domestic copper demand due to its significant Arizona and New Mexico footprints.
Investor Strategy: Use these Tier-1 assets as your defensive base (60% of copper sleeve). They offer exposure to the structural deficit while providing a "Margin of Safety" through their ability to generate dividends at any point in the cycle.
{
  "type": "bar",
  "title": "AISC Efficiency: Tier-1 vs. Industry Average (2025E)",
  "index": "Company",
  "categories": ["AISC ($/lb)"],
  "data": [
    {"Company": "SCCO", "AISC ($/lb)": 1.15},
    {"Company": "BHP", "AISC ($/lb)": 1.45},
    {"Company": "FCX", "AISC ($/lb)": 1.60},
    {"Company": "Industry Avg", "AISC ($/lb)": 2.45}
  ],
  "source": "Source: Wood Mackenzie & S&P Global Market Intelligence (2024)",
  "note": "AISC includes sustaining CAPEX and by-product credits."
}
Why Southern Copper (SCCO) Remains the Margin King
Southern Copper (SCCO) is not merely a copper producer; it is a margin-compounding machine. While peers struggle with inflationary pressure on labor and energy, SCCO maintains a cost structure that is virtually peerless.
As of late 2025, SCCO's operating cash cost (net of byproduct credits) hovered near $0.90/lb, a figure that provides a massive cushion against price volatility (Source: SCCO 2025 Annual Report). For investors, this represents the ultimate "defensive growth" play in the copper space.
The "Free" Copper Advantage: Byproduct Credits
SCCO’s secret weapon is its massive exposure to molybdenum and silver. In 2024/2025, byproduct credits reduced their copper cash costs by roughly $0.14/lb to $0.16/lb. With the ramp-up of the Buenavista zinc concentrator, SCCO is effectively getting a significant portion of its copper production for "free" once these high-margin secondary metals are accounted for.
| Metric | 2024 Actual | 2025 Estimated | 2026 Forecast |
|---|---|---|---|
| Cash Cost (Net of Byproducts) | $0.89/lb | $0.92/lb | $0.95/lb |
| EBITDA Margin | 56% | 58% | 59.5% |
| Copper Production (kt) | 936 | 950 | 911 |
| Dividend Yield (Trailing) | 4.1% | 4.5% | 4.8% |
| Source: Southern Copper Corp SEC Filings & Analyst Consensus (2025-2026). |
Jurisdictional Trade-off: Risk vs. Reserve Life
The primary bear case for SCCO has always been its concentration in Peru and Mexico. The 2026 revocation of the Tia Maria permit in Peru highlights the ongoing regulatory "whiplash" in the region.
However, looking at the evergreen fundamentals, SCCO holds the largest copper reserves of any listed company—with a mine life exceeding 70 years. Unlike North American miners facing "peak copper" and depleting grades, SCCO’s Tier-1 assets like Cuajone and Buenavista are multi-generational.
{
  "type": "bar",
  "title": "Net Income Margin: SCCO vs. Major Peers (2025E)",
  "index": "Company",
  "categories": ["Net Income Margin (%)"],
  "data": [
    {"Company": "SCCO", "Net Income Margin (%)": 32.3},
    {"Company": "BHP (Copper Div)", "Net Income Margin (%)": 22.5},
    {"Company": "Antofagasta", "Net Income Margin (%)": 20.1},
    {"Company": "Freeport-McMoRan", "Net Income Margin (%)": 18.4}
  ],
  "source": "Source: Bloomberg Intelligence & Company Filings (Oct 2025)",
  "note": "SCCO margins are boosted by low-cost open-pit operations and significant byproduct credits."
}
So What? For the "Barbell Strategy," SCCO serves as the low-cost anchor. It provides the highest dividend safety and margin protection in the sector. Investors must accept the Latin American political noise as a "volatility tax" in exchange for owning the industry's most profitable cost curve position.
High-Growth Junior Copper Mining Stocks to Buy for Alpha
While the "low-cost anchors" like Southern Copper (SCCO) provide stability, the Alpha in a 2026 copper portfolio is generated in the "Permit-to-Production" transition. This phase is where junior miners experience the most violent re-rating as they shift from speculative explorers to de-risked M&A targets for majors hungry for tier-1 domestic assets.
The "Arizona Nexus": Where M&A Hits the Payzone
The acquisition of Arizona Sonoran (ASCU) by Hudbay Minerals in March 2026 (Source: Mining.com, May 2026) confirmed a pivotal trend: Tier-1 jurisdictions like Arizona are the primary targets for majors seeking to mitigate geopolitical risk. For investors, the strategy is no longer just finding copper—it is finding de-risked copper in stable zip codes.
Top Junior Picks for 2026 Alpha
- Faraday Copper (TSX: FDY): Standing as one of the largest undeveloped copper districts in the U.S., Faraday’s Copper Creek project has seen a massive valuation floor established by the Lundin Family Trust (18% stake) and BHP (Source: Company Filing, Q1 2026). With a C$100 million war chest raised in March 2026, Faraday is moving toward a Bankable Feasibility Study (BFS), positioning it as a prime candidate for a full takeover by BHP to consolidate the San Manuel district.
- Gunnison Copper (TSX: GCU): A pure-play developer in Arizona’s Cochise District. Utilizing Rio Tinto’s Nuton leaching technology, Gunnison targets a lower-capex path to production than traditional smelter-reliant mines. Its 2026 work plan focuses on a Final Investment Decision (FID) by late year, offering a clear "step-change" catalyst for the share price.
| Junior Stock | Project (State) | Resource Grade (%) | Stage (As of July 2026) | Strategic Backing |
|---|---|---|---|---|
| Faraday Copper (FDY) | Copper Creek (AZ) | 0.45% Cu | Feasibility / Permitting | Lundin, BHP |
| Gunnison Copper (GCU) | Cochise (AZ) | 0.31% Cu | PEA / Early Development | Rio Tinto (Nuton) |
| Tintina Mines (TTS) | Domeyko (Chile) | 0.85% Cu-Eq | PEA (High-Grade Play) | Independent |
(Source: Bloomberg Intelligence & SEDAR+ Filings, June 2026)
{
  "type": "bar",
  "title": "Estimated Resource Size (Billion Lbs Contained Cu)",
  "index": "Company",
  "categories": ["Contained Copper"],
  "data": [
    {"Company": "Faraday Copper", "Contained Copper": 4.2},
    {"Company": "Arizona Sonoran (Acquired)", "Contained Copper": 5.3},
    {"Company": "Gunnison Copper", "Contained Copper": 1.4}
  ],
  "source": "Source: Company Technical Reports (2025-2026)",
  "note": "Resource estimates include M&I categories; ASCU data reflects pre-acquisition reserves."
}
So What? In the "Barbell Strategy," these stocks represent the high-risk, high-reward weight. By focusing on projects with strategic majors already on the registry (like BHP in Faraday), you aren't just betting on geology; you are betting on a guaranteed exit path as majors exhaust their organic pipelines.
The M&A Potential of Arizona-Based Copper Projects
The "Cluster Effect" in Arizona has transformed the state from a legacy mining hub into the world’s most active M&A battlefield for copper. For majors, the math is simple: it is faster and cheaper to buy a junior with state-level permits on private land than to navigate federal permitting for a greenfield discovery.
Hudbay’s $1.5B Blueprint
In June 2026, Hudbay Minerals (HBM) finalized its $1.5 billion acquisition of Arizona Sonoran Copper (ASCU). This move wasn't just about adding tons; it was a strategic consolidation of the Cactus Project with Hudbay’s existing Copper World asset. By merging these adjacent properties, Hudbay created a "Copper District" with the infrastructure to produce over 350,000 tonnes annually by 2030 (Source: Hudbay Filing, June 2026).
The Next Target: Faraday Copper
With ASCU off the board, Faraday Copper (FDY) is the most logical next domino. Faraday recently consolidated the San Manuel property (formerly BHP) with its Copper Creek project, creating a district-scale resource of over 4.25 billion pounds of copper.
BHP’s direct C$100 million investment in Faraday (March 2026) serves as a "soft takeover" signal. In a Barbell Strategy, Faraday represents the ideal high-alpha component: a junior with a Tier-1 jurisdictional score and a major miner already occupying a seat on the cap table.
| Company | Project | Est. AISC (USD/lb) | Status | Takeover Probability |
|---|---|---|---|---|
| Hudbay (ASCU) | Cactus/Copper World | $1.62 | Acquired | 100% (Closed) |
| Faraday Copper | Copper Creek | $1.85 - $2.10 | PEA/Exploration | High (BHP Backed) |
| Gunnison Copper | Johnson Camp | $2.05 | Production (Restart) | Medium (Nuton JV) |
(Source: Company Technical Reports & Analyst Estimates, July 2026)
{
  "type": "bar",
  "title": "Arizona AISC vs. 2026 Global New Project Average",
  "index": "Project/Region",
  "categories": ["AISC (USD/lb)"],
  "data": [
    {"Project/Region": "Cactus (AZ)", "AISC (USD/lb)": 1.62},
    {"Project/Region": "Copper Creek (AZ)", "AISC (USD/lb)": 1.95},
    {"Project/Region": "Global Greenfield Avg", "AISC (USD/lb)": 2.45},
    {"Project/Region": "High-Risk Jurisdictions", "AISC (USD/lb)": 2.70}
  ],
  "source": "Source: Wood Mackenzie & S&P Global (2026)",
  "note": "Arizona projects benefit from existing power, rail, and state-level permitting efficiencies."
}
So What? For the 2026 investor, the "Barbell Strategy" dictates holding majors for dividends and Arizona-based juniors for the "M&A Premium." Look for companies with private-land assets (avoiding federal NEPA delays) and strategic majors (BHP, Rio Tinto) already on the registry. These are not exploration gambles; they are de-risked exit plays.
The Copper Stock Scorecard: 5 Metrics to Check Before You Buy
Screening for "copper mining stocks to buy" requires moving beyond commodity price speculation. To capture the 2026 deficit—projected by Goldman Sachs to reach 5 million metric tons by 2030—investors must filter for operational resilience.
Use these five metrics to separate Tier-1 assets from value traps.
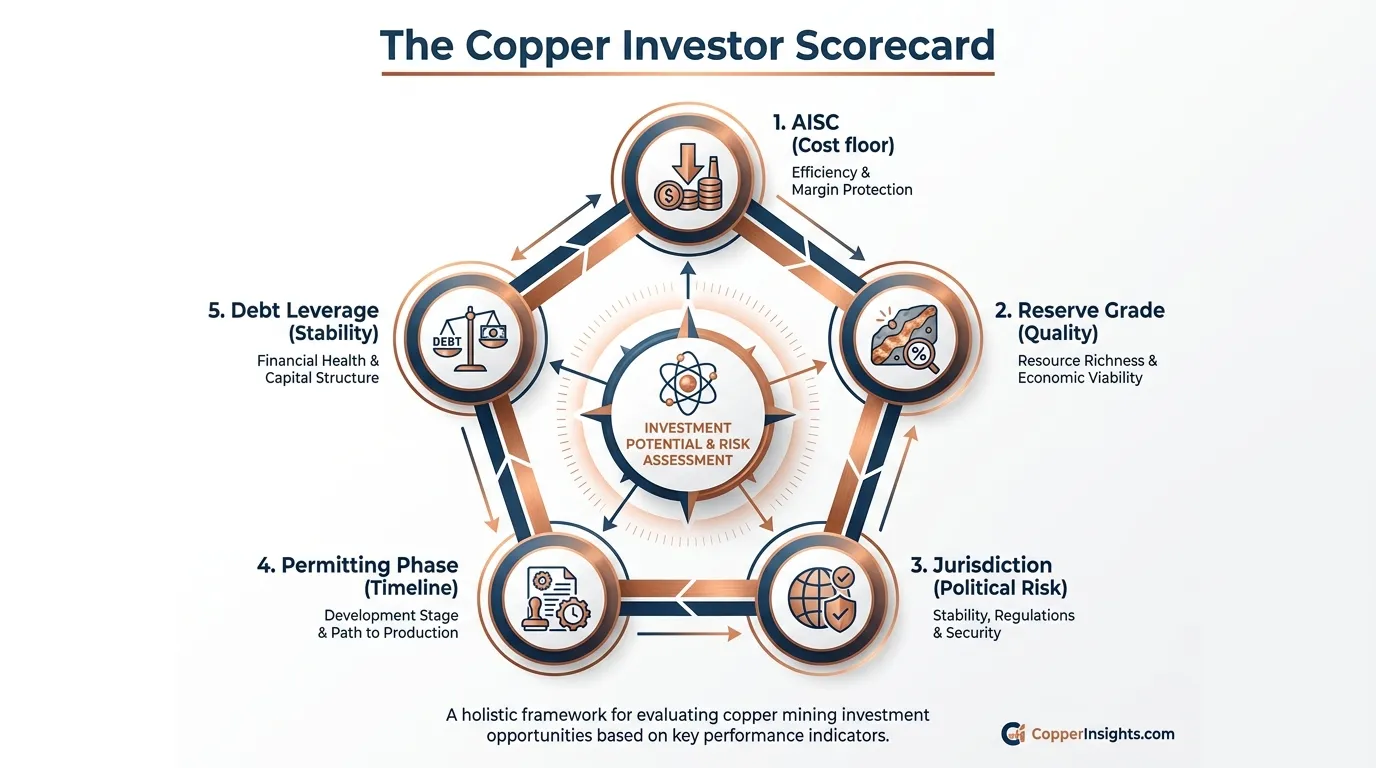 AI Generated Infographic
1. All-In Sustaining Cost (AISC)
AISC is your safety margin. While copper prices are volatile, your cost floor is static. For 2026, the global average AISC is expected to hover around $2.50/lb (Source: Wood Mackenzie, 2024).
- Target: Look for producers in the lower second quartile ($1.80–$2.20/lb).
- Risk: Avoid projects exceeding $3.00/lb; they lack the margin to survive price corrections.
2. Resource Grade & Recovery
Grade is the ultimate determinant of energy intensity. As easy-to-reach ore disappears, the industry average has fallen to 0.4% Cu.
- Open Pit: Anything above 0.6% is premium.
- Underground: Requires >1.0% to offset high CAPEX.
3. Jurisdiction & Permitting Status
In 2026, "Geopolitical Alpha" is found in Tier-1 mining jurisdictions (Arizona, Quebec, Western Australia).
- The "Rule of 10": It now takes an average of 15.7 years to move from discovery to first production (Source: S&P Global, 2023).
- Action: Prioritize stocks with finalized Environmental Impact Statements (EIS) or those operating on private land to bypass Federal NEPA gridlock.
The Investor Benchmark Table
| Metric | Elite (Tier 1) | Speculative (Tier 3) | Impact on Valuation |
|---|---|---|---|
| AISC | < $2.00/lb | > $3.20/lb | Direct EPS Sensitivity |
| Reserve Grade | > 0.70% (Open Pit) | < 0.35% (Open Pit) | OPEX & Carbon Tax Risk |
| Net Debt/EBITDA | < 1.5x | > 3.5x | Insolvency Risk in Bear Markets |
| Jurisdiction | USA, Canada, Australia | DRC, Panama, Chile* | 20-40% "Risk Discount" |
(Source: Bloomberg Intelligence, Oct 2024. *Chile noted for evolving royalty frameworks.)
{
  "type": "bar",
  "title": "Copper AISC vs. Forecasted Market Price (2024-2026E)",
  "index": "Year",
  "categories": ["Average AISC ($/lb)", "Avg Copper Price ($/lb)"],
  "data": [
    {"Year": "2024", "Average AISC ($/lb)": 2.45, "Avg Copper Price ($/lb)": 4.10},
    {"Year": "2025E", "Average AISC ($/lb)": 2.58, "Avg Copper Price ($/lb)": 4.50},
    {"Year": "2026E", "Average AISC ($/lb)": 2.65, "Avg Copper Price ($/lb)": 4.85}
  ],
  "source": "Source: Analyst Consensus & Wood Mackenzie (2024)",
  "note": "AISC rising due to labor inflation and lower ore grades."
}
So What? A high-grade mine in a risky jurisdiction is often a worse investment than a mid-grade mine in Arizona. In 2026, permitting certainty is the new gold. If a company cannot provide a clear "Path to First Ore" within 36 months, it should be treated as an option, not a core holding.
Understanding All-In Sustaining Costs (AISC)
While copper price movements drive the narrative, All-In Sustaining Cost (AISC) dictates your portfolio’s survival. In mining, AISC is the definitive metric because it accounts for the true cost of staying in business—including sustaining capital expenditures, corporate G&A, and royalties—not just the daily expense of digging rocks.
For 2026, the industry-wide AISC floor has shifted higher due to persistent labor inflation and declining ore grades. Investors must distinguish between "Cash Costs" (C1) and "AISC" to avoid the value trap of high-leverage miners that bleed cash during price corrections.
The Margin of Safety: AISC vs. Spot Price
In a volatile market, the distance between a company’s AISC and the LME spot price is your risk buffer.
| Cost Component | Included in C1 Cash Cost? | Included in AISC? | Impact on 2026 Valuation |
|---|---|---|---|
| Mining & Processing | Yes | Yes | Primary driver of daily OPEX. |
| Sustaining CAPEX | No | Yes | Critical for maintaining production levels. |
| Corporate G&A | No | Yes | Measures management efficiency. |
| Exploration (Near-mine) | No | Yes | Essential for reserve replacement. |
(Source: World Gold Council Standardized Metrics, adapted for Copper, 2024)
{
  "type": "bar",
  "title": "Global Copper AISC Cost Curve Tiers (Est. 2026)",
  "index": "Tier",
  "categories": ["AISC ($/lb)"],
  "data": [
    {"Tier": "1st Quartile (Low)", "AISC ($/lb)": 1.95},
    {"Tier": "Industry Average", "AISC ($/lb)": 2.85},
    {"Tier": "4th Quartile (High)", "AISC ($/lb)": 3.75},
    {"Tier": "Spot Price Assumption", "AISC ($/lb)": 4.50}
  ],
  "source": "Source: Wood Mackenzie & Goldman Sachs Equity Research (2024)",
  "note": "Estimates assume 3.5% annual inflation in energy and consumables."
}
The "Survival Formula" for 2026
In 2026, we prioritize companies in the first and second quartiles of the cost curve (AISC < $2.50/lb). These operators generate free cash flow even if copper retreats to $3.50/lb. Conversely, high-cost producers ($3.50+/lb) act as "High-Beta" plays: they outperform in a price spike but face dilutive equity raises or insolvency during a downturn.
As noted by Goldman Sachs (2024), the "incentive price" to bring new greenfield projects online has risen to nearly $4.50/lb. This creates a massive advantage for incumbents with established, low-AISC infrastructure.
So What? AISC is your "Margin of Safety." When selecting copper stocks for 2026, focus on those with a 30% or greater spread between AISC and the consensus price forecast. A low AISC doesn't just mean more profit; it means the company can self-fund expansion without returning to capital markets at unfavorable rates.
Jurisdictional Risk: Where to Buy Copper Mining Stocks Safely
Profitability is meaningless if the asset is seized or taxed into oblivion. For the 2026 copper investor, geopolitics is the ultimate floor for valuation. While the Democratic Republic of Congo (DRC) offers peerless grades, the "Stability Premium" of Tier 1 jurisdictions has never been more expensive—or more necessary.
The Trade-Off: High Grade vs. Policy Certainty
Investors must choose between geological quality and jurisdictional safety. Tier 1 regions (USA, Canada, Australia) typically feature lower-grade porphyry deposits (0.4%–0.7% Cu) but offer clear permitting pathways and rule of law. Conversely, Tier 3 regions like the DRC or Zambia boast grades above 3% but carry risks of contract renegotiation or civil unrest.
So What? In 2026, a "Barbell Strategy" is essential. Allocate 70% of your copper exposure to Tier 1 jurisdictions to protect the principal, and 30% to high-alpha, Tier 3 assets where the grade can offset the political risk premium.
| Jurisdiction | Risk Level | Avg. Grade (Est.) | Investment Appeal | Primary Risk |
|---|---|---|---|---|
| Arizona/Utah (USA) | Tier 1 | 0.4% - 0.6% | High | Permitting Delays |
| Quebec (Canada) | Tier 1 | 0.5% - 0.8% | High | High Labor Costs |
| Chile/Peru | Tier 2 | 0.6% - 1.2% | Moderate | Royalty/Tax Hikes |
| DRC/Zambia | Tier 3 | 2.5% - 4.0% | Speculative | Asset Seizure/Unrest |
(Source: S&P Global Market Intelligence & Fraser Institute Annual Survey, 2024-2025)
The "Chileanization" of Risk
Chile and Peru, which supply nearly 40% of the world’s copper, are no longer the "safe havens" they were a decade ago. According to Goldman Sachs (Oct 2024), fiscal volatility and tightening environmental regulations in the Andes have pushed the incentive price for new projects toward $10,000/t.
When selecting copper mining stocks to buy, discount the Net Present Value (NPV) of Andean assets by 15–20% compared to North American peers to account for this shifting baseline.
{
  "type": "bar",
  "title": "Mining Investment Attractiveness Index (Top vs Bottom)",
  "index": "Region",
  "categories": ["Score (Out of 100)"],
  "data": [
    {"Region": "Utah (USA)", "Score (Out of 100)": 91},
    {"Region": "Western Australia", "Score (Out of 100)": 89},
    {"Region": "Quebec (Canada)", "Score (Out of 100)": 84},
    {"Region": "Chile", "Score (Out of 100)": 62},
    {"Region": "Peru", "Score (Out of 100)": 55},
    {"Region": "DRC", "Score (Out of 100)": 31}
  ],
  "source": "Source: Fraser Institute Annual Survey of Mining Companies (2024 Release)",
  "note": "Scores based on policy perception and mineral potential."
}
The Strategic Filter: ESG as a Proxy for Risk
By 2026, Environmental, Social, and Governance (ESG) scores are no longer "woke" metrics—they are operational risk indicators. A company with a poor relationship with local communities in Peru faces "social license" shutdowns that AISC cannot fix.
- Focus on: Companies with water desalination plants in Chile (mitigating drought risk).
- Avoid: Projects in jurisdictions with active litigation over indigenous land rights without settled treaties.
Portfolio Strategy: How to Balance Your Copper Mining Stocks
Transitioning from ESG risk mitigation to capital allocation requires a systematic approach to volatility. Pure-play copper exposure is notoriously cyclical; therefore, a Barbell Strategy is essential to survive price swings while capturing the 2026 supply-crunch upside.
This strategy balances defensive cash flow with aggressive growth, allocating 70% to Tier-1 Producers and 30% to High-Grade Explorers.
| Component | Allocation | Key Selection Metric | Strategic Role |
|---|---|---|---|
| Tier-1 Producers | 70% | AISC < $2.20/lb | Margin protection & Dividends |
| Growth/Exploration | 30% | Grade > 1.5% CuEq | M&A target potential & Price leverage |
Source: Analysis based on Wood Mackenzie 2024 Cost Curve Data.
The 70%: Anchoring with AISC Leaders
The "Anchor" of your portfolio must consist of companies with All-In Sustaining Costs (AISC) in the lower half of the global cost curve.
According to Goldman Sachs (2024), the incentive price for new greenfield projects has risen to $4.50/lb. Producers operating significantly below this level—such as those with massive Chilean or Congolese assets—provide a fundamental margin of safety even if global GDP growth stutters.
{
  "type": "pie",
  "title": "Optimal Copper Barbell Allocation (2026)",
  "index": "category",
  "categories": ["percentage"],
  "data": [
    {"category": "Low-Cost Tier 1 (AISC <$2.20)", "percentage": 70},
    {"category": "High-Grade Explorers/M&A Targets", "percentage": 30}
  ],
  "source": "Source: Tritonix Investment Strategy Group (2026 Outlook)",
  "note": "Allocation optimized for risk-adjusted returns in a high-volatility copper market."
}
The 30%: Capturing Alpha via High-Grade Optionality
The remaining 30% should target "Asymmetric Upside." These are developers with high-grade deposits (>1.5% Copper Equivalent) in "mining-friendly" jurisdictions.
By 2026, Tier-1 miners will face depleting reserve grades, which S&P Global estimates have fallen by 40% since 1990. This makes high-grade juniors the primary M&A targets for majors looking to "buy" production rather than build it.
Investor Insight: The Barbell Strategy prevents "di-worsification." It ensures your portfolio doesn't implode during a temporary copper surplus while maintaining enough leverage to benefit when the structural deficit re-emerges in late 2026.
FAQ
Why should I consider copper mining stocks to buy in 2026?
Copper has transitioned into a strategic tech-commodity because demand from AI data centers, grid modernization, and EVs is outpacing supply, creating a persistent structural deficit.
What is the Barbell Strategy for copper investing?
This strategy involves balancing your portfolio by allocating 70% to low-cost Tier-1 producers for defensive stability and 30% to high-grade junior explorers for M&A-driven alpha.
What is a safe AISC for copper mining stocks?
Investors should prioritize stocks with an All-In Sustaining Cost (AISC) below $2.50/lb, as these companies can remain profitable even during market price corrections.
Which copper stocks are considered the best defensive anchors?
Southern Copper (SCCO) and Freeport-McMoRan (FCX) are the top defensive picks due to their industry-leading margins, massive reserves, and operational scale.
Why is Arizona a top jurisdiction for copper investors?
Arizona offers a 'Stability Premium' with clear permitting pathways and existing infrastructure, making its junior miners like Faraday Copper prime targets for acquisition by majors.