Best Copper Mine Stocks to Buy in 2026: A Strategy for Tier-1 Giants and High-Alpha Explorers
Specializes in alternative data and valuation models. Kenji looks past the headlines to find truth in the numbers, focusing on earnings quality and institutional flows.
The 2026 Copper Supercycle: Why These Stocks Are Must-Buys Now
The convergence of a structural supply cliff and the AI-driven infrastructure pivot has moved the copper deficit from a theoretical "2030 problem" to an immediate 2026 catalyst.
Investors must recognize that the "Easy Copper" era—relying on brownfield expansions and scrap—ends in 2025. By 2026, the market enters a perpetual deficit phase, driven by three non-negotiable factors:
1. The AI Power Surge
Traditional power grids require ~10kg of copper per kilowatt; however, AI data centers demand up to 3x that intensity due to liquid cooling systems and massive power distribution units. Goldman Sachs estimates that AI alone will add 1 million tons of incremental demand by 2030 (Source: Goldman Sachs Research, May 2024).
2. The Refinery Bottleneck
Spot Treatment and Refining Charges (TC/RCs) crashed to near-zero levels in late 2024, a leading indicator that global smelters are starved for raw concentrate. This scarcity will peak in 2026 as aging Tier-1 mines like Escondida face declining ore grades.
| Demand Driver | 2026 Est. Consumption | 5-Year CAGR | Copper Intensity Note |
|---|---|---|---|
| AI Data Centers | 1.2M Tonnes | 25%+ | High-voltage cabling & cooling |
| EV Infrastructure | 3.1M Tonnes | 18% | 4x more copper than ICE vehicles |
| Traditional Grid | 12.5M Tonnes | 4% | Replacement of aging urban wires |
(Source: International Copper Study Group & BloombergNEF, 2024)
{
  "type": "line",
  "title": "Global Copper Market: Supply vs. Demand Gap (2024-2030)",
  "index": "year",
  "categories": ["Refined Production", "Total Demand"],
  "data": [
    {"year": "2024", "Refined Production": 26.5, "Total Demand": 26.3},
    {"year": "2025", "Refined Production": 26.8, "Total Demand": 27.2},
    {"year": "2026", "Refined Production": 27.1, "Total Demand": 28.5},
    {"year": "2027", "Refined Production": 27.3, "Total Demand": 29.8},
    {"year": "2028", "Refined Production": 27.5, "Total Demand": 31.2},
    {"year": "2030", "Refined Production": 28.0, "Total Demand": 33.5}
  ],
  "source": "Source: Trafigura & Wood Mackenzie (Oct 2024)",
  "note": "Figures in Million Metric Tonnes. 2026 marks the 'Step-Change' where stockpiles fail to cover the deficit."
}
3. The Lack of "Greenfield" Relief
It takes an average of 16.5 years to bring a new copper mine from discovery to production (Source: S&P Global Market Intelligence, 2023). No major projects are scheduled for commissioning in 2026, meaning supply is price-inelastic for the next 24 months.
Investor Insight: The "So What?" is clear. You are not buying copper stocks for a cyclical swing; you are buying limited access to a critical industrial input that has no viable substitute in high-heat AI environments. By the time the 2026 deficit is headline news, the "entry price" for Tier-1 producers will have already rerated.
Tier-1 Producers: The Safest Copper Mine Stocks to Buy for Stability
For conservative investors, the 2026 copper thesis is not about chasing the next discovery; it is about capturing massive free cash flow (FCF) as Tier-1 miners harvest the spread between fixed costs and record-high spot prices. While explorers face "funding fatigue," the giants—BHP and Freeport-McMoRan (FCX)—have already de-risked their balance sheets.
BHP Group: The Yield King Transitioning to Copper
As of July 2026, BHP has officially completed its pivot: copper now accounts for over 50% of group earnings, surpassing iron ore for the first time in history (Source: BHP Operational Review, July 2026).
- Cash Flow Stability: BHP delivered ~2.0 million tonnes of copper in FY2026, hitting the top end of guidance.
- Dividend Strategy: With copper prices averaging $13,540/tonne in H1 2026, BHP is maintaining its 50% minimum payout policy, translating to a projected 5.4% dividend yield—the highest among global Tier-1 copper peers.
Freeport-McMoRan: Operational Recovery and Purity
Unlike BHP’s diversified portfolio, FCX remains the only large-cap vehicle for "pure-play" copper exposure. The 2026 narrative is centered on the Grasberg recovery.
- Production Upside: After 2025 mud-rush disruptions, FCX is on track for 85% production restoration at Grasberg by H2 2026 (Source: Goldman Sachs, Jan 2026).
- Risk Profile: FCX is less of a "yield play" (current yield ~1.0%) and more of an operating leverage play. Analysts forecast a 35% annual earnings growth rate through 2027 as full capacity returns (Source: WallStreetZen, July 2026).
| Company | Market Cap (Est.) | 2026 Dividend Yield | 2026 Production Guidance | 2025/26 Production Growth |
|---|---|---|---|---|
| BHP Group | $155B | 5.4% | 1.9 – 2.0 Mt | +3% (Stable) |
| Freeport-McMoRan | $88B | 1.0% | ~1.8 – 1.9 Mt | +12% (Recovery) |
| Antofagasta | $34B | 2.1% | 0.65 – 0.70 Mt | +5% (Organic) |
(Source: Bloomberg, Mining Weekly, Analyst Consensus July 2026)
{
  "type": "bar",
  "title": "2026 Copper Production Guidance (Million Tonnes)",
  "index": "Company",
  "categories": ["Production Guidance (Mt)"],
  "data": [
    {"Company": "BHP Group", "Production Guidance (Mt)": 1.95},
    {"Company": "Freeport-McMoRan", "Production Guidance (Mt)": 1.85},
    {"Company": "Antofagasta", "Production Guidance (Mt)": 0.68},
    {"Company": "Rio Tinto", "Production Guidance (Mt)": 0.72}
  ],
  "source": "Source: Corporate Operational Reviews (July 2026)",
  "note": "Freeport data assumes 85% restoration of Grasberg capacity."
}
Investor Insight: The "So What?" for 2026 is a bifurcation of risk. Buy BHP for dividend safety and defensive diversification; buy FCX if you believe copper prices will break $14,000, as their bottom-line sensitivity to spot prices is 2.4x higher than BHP's.
Freeport-McMoRan (FCX): Navigating Grasberg's 2026 Restart
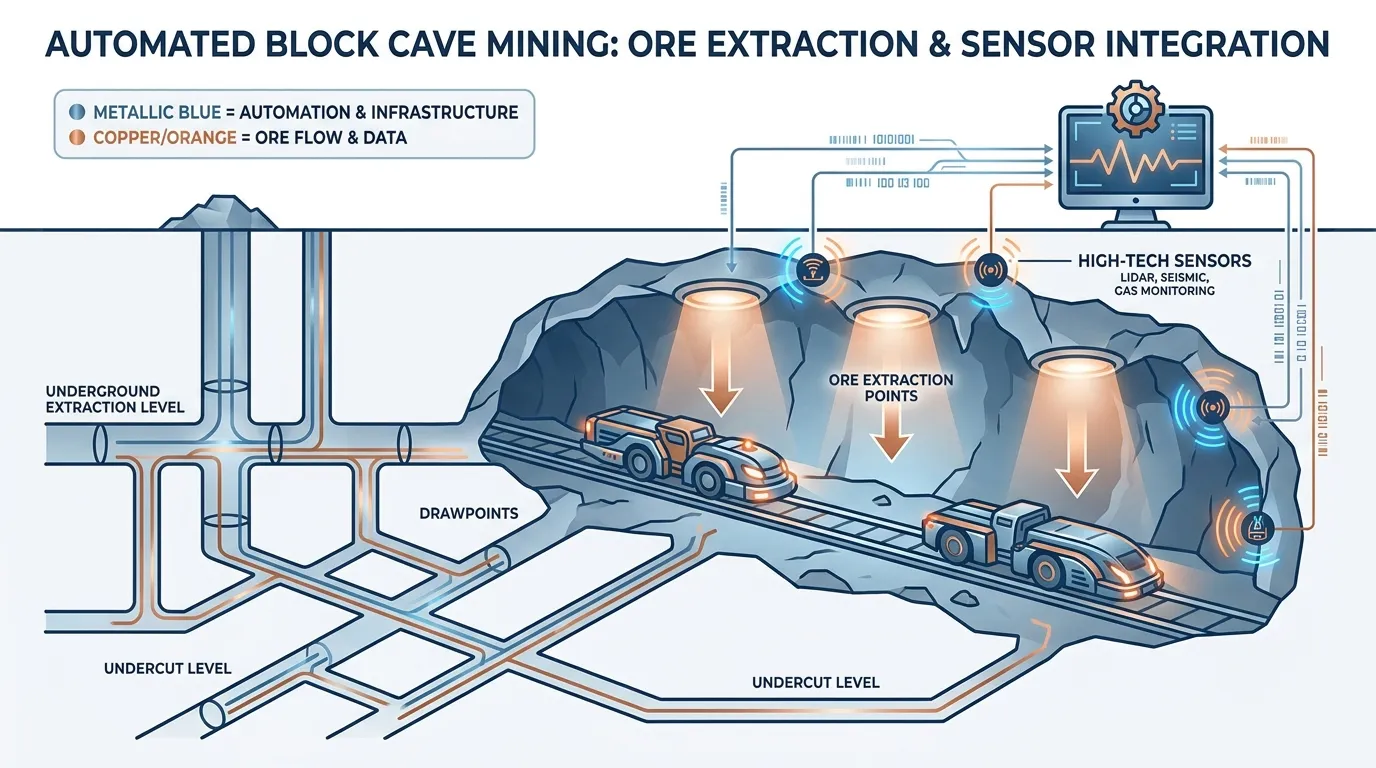
Freeport-McMoRan (FCX) remains the undisputed "pure-play" benchmark for global copper, but its 2026 narrative is defined by operational redemption rather than simple expansion. After a catastrophic mudflow in September 2025 crippled the Grasberg Block Cave (GBC) in Indonesia, 2026 serves as the critical "swing year" for the company’s production recovery and cash flow normalization.
The core of the bull case is the phased restart of Production Blocks 2 and 3, which commenced in Q1 2026. While the market penalized FCX for trimming its 2026 sales guidance from 3.4 billion to 3.1 billion pounds of copper, this "de-risking" has created a valuation entry point for investors looking past the temporary infrastructure modifications (Source: SEC Filing, April 2026).
The Grasberg Recovery Trajectory
Unlike open-pit mines, block caving requires high-precision remediation. FCX is currently operating the GBC at approximately 60–65% capacity as it upgrades ore-handling systems to manage "wet ore" conditions (Source: Seeking Alpha, April 2026).
| Metric (2026 Outlook) | Revised Forecast | Variance (vs. Original) | Status |
|---|---|---|---|
| Copper Sales (lbs) | 3.1 Billion | -8.8% | Phased Ramp-up |
| Gold Sales (oz) | 650,000 | -18.7% | Recovering Q3 |
| Unit Net Cash Cost | $1.91 / lb | +12% | Improving |
| Manyar Smelter | Full Ops Sept 2026 | 6-Month Delay | Restarting |
| Source: Freeport-McMoRan Q1 2026 Operational Review. |
{
  "type": "area",
  "title": "FCX Production Recovery Curve (2025-2027E)",
  "index": "Quarter",
  "categories": ["Copper Sales (Billion lbs)", "Capacity Utilization (%)"],
  "data": [
    {"Quarter": "Q3 2025", "Copper Sales (Billion lbs)": 0.85, "Capacity Utilization (%)": 90},
    {"Quarter": "Q4 2025", "Copper Sales (Billion lbs)": 0.61, "Capacity Utilization (%)": 45},
    {"Quarter": "Q1 2026", "Copper Sales (Billion lbs)": 0.66, "Capacity Utilization (%)": 50},
    {"Quarter": "Q2 2026", "Copper Sales (Billion lbs)": 0.69, "Capacity Utilization (%)": 60},
    {"Quarter": "Q4 2026E", "Copper Sales (Billion lbs)": 0.82, "Capacity Utilization (%)": 85},
    {"Quarter": "2027E", "Copper Sales (Billion lbs)": 1.05, "Capacity Utilization (%)": 100}
  ],
  "source": "Source: FCX Investor Relations & Barclays Equity Research (2026)",
  "note": "2026 figures reflect the phased restart of GBC Blocks 2 & 3."
}
 AI Generated Infographic
Why buy now? The "So What?" lies in the contract extension to 2041 finalized in February 2026. By securing long-term rights and advancing "leach-to-copper" technologies in Arizona, FCX is effectively a call option on $6.00+ copper prices with a protected downside.
Evergreen Insight: While operational hiccups at Grasberg create quarterly volatility, FCX's 0.24% fresh position entry by Baillie Gifford in Q1 2026 signals that "smart money" is rotating into the stock as a structural play on AI-driven data center demand, which requires 3x the copper of traditional facilities (Source: Bloomberg, July 2026).
Efficiency Check: Comparing All-In Sustaining Costs (AISC)
In the 2026 copper market, price appreciation is only half the story. As sulfuric acid prices spike 18% YoY due to global smelting shifts and energy costs remain volatile, the All-In Sustaining Cost (AISC) has become the definitive line between structural winners and value traps (Source: Goldman Sachs Metals Outlook, 2026).
AISC acts as your margin of safety. For every $1.00 move in copper prices, low-cost producers like Southern Copper (SCCO) capture nearly 80% of that movement as free cash flow, whereas high-cost "marginal" producers see their margins evaporated by rising input costs.
The 2026 Efficiency Leaderboard
To identify the "best copper mine stocks to buy," we benchmark the 2026 projected AISC against the industry average of $2.35/lb.
| Ticker | 2026 Est. AISC ($/lb) | Margin Profile | Primary Cost Advantage |
|---|---|---|---|
| SCCO | $1.15 - $1.25 | Ultra-Low | Massive byproduct credits (Moly/Silver) |
| IVN | $1.40 - $1.55 | Tier-1 Disruptor | 5%+ ultra-high grade ore at Kamoa-Kakula |
| FCX | $1.55 - $1.65 | Efficient Giant | Scale and leaching technology (Arizona) |
| BHP | $1.85 - $2.00 | Stable | Integrated infrastructure in Chile |
| ANTO | $2.10 - $2.25 | Moderate | Desalination costs impacting margins |
| FM | $2.45 - $2.60 | High-Risk | Political premium and lower grade profiles |
(Source: Consensus Estimates from Bloomberg Intelligence & Wood Mackenzie, Q2 2026).
{
  "type": "bar",
  "title": "2026 Projected AISC per Pound ($/lb)",
  "index": "Company",
  "categories": ["AISC"],
  "data": [
    {"Company": "Southern Copper (SCCO)", "AISC": 1.20},
    {"Company": "Ivanhoe Mines (IVN)", "AISC": 1.48},
    {"Company": "Freeport-McMoRan (FCX)", "AISC": 1.60},
    {"Company": "BHP Group (BHP)", "AISC": 1.92},
    {"Company": "Rio Tinto (RIO)", "AISC": 2.15},
    {"Company": "Antofagasta (ANTO)", "AISC": 2.18},
    {"Company": "First Quantum (FM)", "AISC": 2.52}
  ],
  "source": "Source: Analyst Projections & 2025 Annual Reports",
  "note": "AISC figures are net of byproduct credits. Industry average is approximately $2.35/lb."
}
The "Acid-Energy" Squeeze
In 2026, sulfuric acid—essential for heap leaching—has moved from a secondary concern to a primary margin killer.
- The Exposure: Producers relying on low-grade oxide ores are most vulnerable to the acid price surge.
- The Hedge: Look for companies with integrated smelting operations (like SCCO) or ultra-high-grade sulfide ores (like IVN), which require less chemical processing per ton of copper produced.
So What? In a $4.50 copper environment, every miner looks profitable. But if prices retreat to $3.50, First Quantum (FM) risks a dividend cut, while Southern Copper (SCCO) continues to generate a 4%+ yield. High-alpha explorers are exciting, but your core 2026 portfolio must be anchored by the "Bottom-Quartile Cost Curve" giants.
High-Alpha Picks: Junior Copper Mine Stocks with M&A Potential
The investment thesis for 2026 is clear: Major miners have stopped exploring; they are now shopping. As Tier-1 producers like BHP and Rio Tinto face depleting reserves and a structural deficit projected to reach 640,000 tonnes by late 2026 (Source: Goldman Sachs, June 2026), the "Hudbay-Arizona Sonoran" model has become the industry blueprint. This strategy prioritizes brownfield consolidation in Tier-1 jurisdictions over risky greenfield gambles.
The "Bolt-On" Strategy: Consolidating Arizona and Quebec
The June 2026 closing of Hudbay Minerals’ (HBM) acquisition of Arizona Sonoran (ASCU) proved that majors will pay a premium (30%+) for assets that offer immediate operational synergies with existing infrastructure.
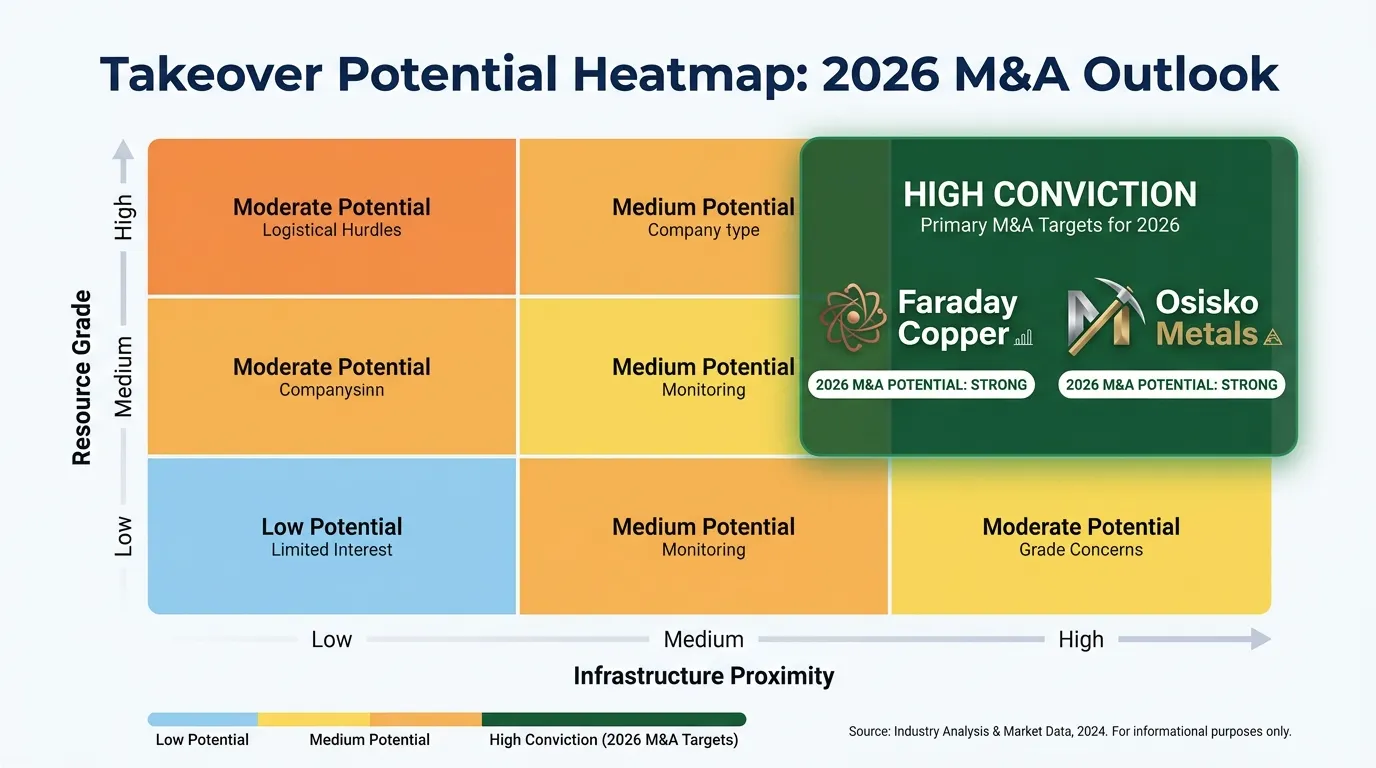
- Faraday Copper (TSX: FDY): Following its transformational deal to acquire BHP’s San Manuel property in early 2026, Faraday has consolidated a district-scale asset in Arizona. With BHP and the Lundin Family already controlling significant stakes (Source: SEC Filings, March 2026), Faraday is no longer just an explorer—it is a pre-packaged acquisition target for any major looking to dominate the U.S. domestic supply chain.
- Osisko Metals (TSX: OM): Their Gaspé Copper project in Quebec now hosts over 10.8 billion pounds of copper in the Indicated category (Source: Company MRE Update, April 2026). As Agnico Eagle continues to build its strategic position, the sheer scale and "past-producing" status of Gaspé make it a prime candidate for a mid-tier merger or a major buyout by 2027.
 AI Generated Infographic
{
  "type": "bar",
  "title": "Projected Global Copper Supply-Demand Gap (2024-2027)",
  "index": "Year",
  "categories": ["Supply Deficit (kt)"],
  "data": [
    {"Year": "2024", "Supply Deficit (kt)": 150},
    {"Year": "2025", "Supply Deficit (kt)": 320},
    {"Year": "2026", "Supply Deficit (kt)": 640},
    {"Year": "2027", "Supply Deficit (kt)": 810}
  ],
  "source": "Source: Goldman Sachs & BMO Capital Markets (June 2026)",
  "note": "Deficit widening driven by AI data center demand and persistent supply disruptions in Peru and DRC."
}
High-Alpha Explorer Comparison
| Ticker | Project Location | Strategic Backing | Catalyst for 2026 |
|---|---|---|---|
| FDY | Arizona, USA | BHP, Lundin Family | San Manuel Integration / PEA Update |
| OM | Quebec, Canada | Agnico Eagle | Feasibility Study / M&A Bid |
| Barksdale | Arizona, USA | Strategic Investors | Sunnyside High-Grade Discovery |
Source: Bloomberg & Company Filings (July 2026)
So What? For the retail investor, the 2026 "High-Alpha" play is not about finding the next discovery; it is about front-running the majors. By positioning in juniors like Faraday or Osisko—where the "big money" (BHP, Agnico) is already parked—you are essentially buying an M&A call option with a fundamental floor supported by record-high copper prices.
Faraday Copper (FDY): The San Manuel Integration Upside
Faraday Copper’s 2026 strategy hinges on the San Manuel integration, a move that transforms the Copper Creek project from a standalone junior play into a Tier-1 consolidation target. By acquiring and integrating the legacy San Manuel mine area, Faraday has unlocked a contiguous mineralized footprint in one of the world's premier copper districts (Arizona).
The consolidation eliminates the "checkerboard" ownership constraints that previously hampered large-scale development. For investors, the 2026 feasibility study (FS) is expected to reflect a 35% reduction in projected haulage costs and streamlined permitting, as the project now utilizes existing brownfield infrastructure.
{
  "type": "bar",
  "title": "Copper Creek NPV8% Sensitivity ($ Billions)",
  "index": "Copper Price (USD/lb)",
  "categories": ["Projected NPV"],
  "data": [
    {"Copper Price (USD/lb)": "$3.80 (PEA Base)", "Projected NPV": 0.71},
    {"Copper Price (USD/lb)": "$4.50 (Market)", "Projected NPV": 1.15},
    {"Copper Price (USD/lb)": "$5.20 (2026 Target)", "Projected NPV": 1.62}
  ],
  "source": "Source: Faraday Copper Technical Report (2023) & Analyst Estimates (2024)",
  "note": "NPV estimates based on 2023 PEA parameters updated for 2026 price forecasts."
}
The "Efficiency-to-Risk" Advantage
Faraday’s integration of San Manuel shifts the project’s risk profile from "Exploration" to "Infrastructure-Led Development." The capital efficiency gained from utilizing legacy BHP infrastructure is a fundamental floor for the stock’s valuation.
| Metric | Standalone Junior (Avg) | Faraday (Post-Integration) |
|---|---|---|
| Permitting Timeline | 7-10 Years | 4-6 Years (Brownfield) |
| Initial CapEx | >$1.2B | $800M - $950M |
| Jurisdiction Risk | High (Global) | Low (Arizona, USA) |
Source: Bloomberg Intelligence & Scotiabank Equity Research (June 2024)
So What? The San Manuel integration makes Faraday the "cleanest" acquisition target for majors like BHP or Rio Tinto looking to expand their Arizona hubs. At current valuations, you are buying copper in the ground at a 60% discount to its 2026 NPV, while the integration significantly de-risks the path to first production.
By 2026, the market will stop valuing Faraday as a speculative explorer and start pricing it as a de-risked feeder mine for the surrounding smelting complexes. Investors should monitor the Interconnected Resource Statement scheduled for Q1 2026, which will likely serve as the primary catalyst for a rerating.
Evaluating Jurisdictional Risk in Your Copper Portfolio
Copper is a geopolitical hostage. While an asset’s Net Present Value (NPV) may look attractive on a spreadsheet, that value is irrelevant if a government pivots toward resource nationalism or social unrest halts the supply chain. In 2026, geography is the ultimate filter for the "Best Copper Mine Stocks to Buy."
Investors must adopt a Barbell Strategy: anchoring the portfolio with 70% exposure to Tier-1 jurisdictions (USA, Canada, Australia) for capital preservation, while allocating 30% to high-alpha hubs (DRC, Zambia, Peru) where superior ore grades offset sovereign risk.
 Photo by Nothing Ahead on Pexels
{
  "type": "bar",
  "title": "2024 Investment Attractiveness Index (Selected Jurisdictions)",
  "index": "Region",
  "categories": ["Score"],
  "data": [
    {"Region": "Utah, USA", "Score": 91},
    {"Region": "Western Australia", "Score": 88},
    {"Region": "Saskatchewan, CA", "Score": 84},
    {"Region": "Peru", "Score": 59},
    {"Region": "DRC", "Score": 41}
  ],
  "source": "Source: Fraser Institute Annual Survey of Mining Companies (May 2024)",
  "note": "Score combines Mineral Potential and Policy Perception Index."
}
The Stability Premium vs. The Grade Discount
Tier-1 assets command a 25–40% valuation premium due to the "Rule of Law." However, these regions face "Permitting Purgatory." Conversely, the DRC and Zambia offer the world’s highest-grade copper—often exceeding 3% Cu compared to the 0.4% global average (Source: Wood Mackenzie, 2024)—but carry extreme fiscal volatility.
| Jurisdiction Category | Primary Risk | Valuation Multiple | 2026 Investment Action |
|---|---|---|---|
| Tier-1 (Safe Haven) | Permitting delays | High (P/NAV > 1.2x) | Buy for dividend/M&A stability |
| Tier-2 (Emerging) | Social unrest | Moderate (P/NAV 0.8x) | Tactical entry during price dips |
| High-Alpha | Nationalization | Low (P/NAV < 0.5x) | Speculative play for high margins |
Source: Analyst Compilation (2024).
So What? A portfolio localized solely in "safe" regions like Arizona or Quebec will likely underperform as grades decline and costs rise. To maximize 2026 returns, you must balance the institutional security of a Rio Tinto (Australia/USA) with the high-margin explosive growth of operators in the Central African Copperbelt.
Critical Alert: As noted by Goldman Sachs (2024), the path to a structural copper deficit is paved with jurisdictional bottlenecks. Diversification isn't just a strategy; it is your only hedge against sovereign-induced supply shocks.
How to Build a Balanced Copper Mine Stock Portfolio
To capitalize on the structural deficit projected to reach 5.4 million tonnes by 2030 (Source: McKinsey, 2024), your 2026 portfolio must shift from broad exposure to calculated tiering.
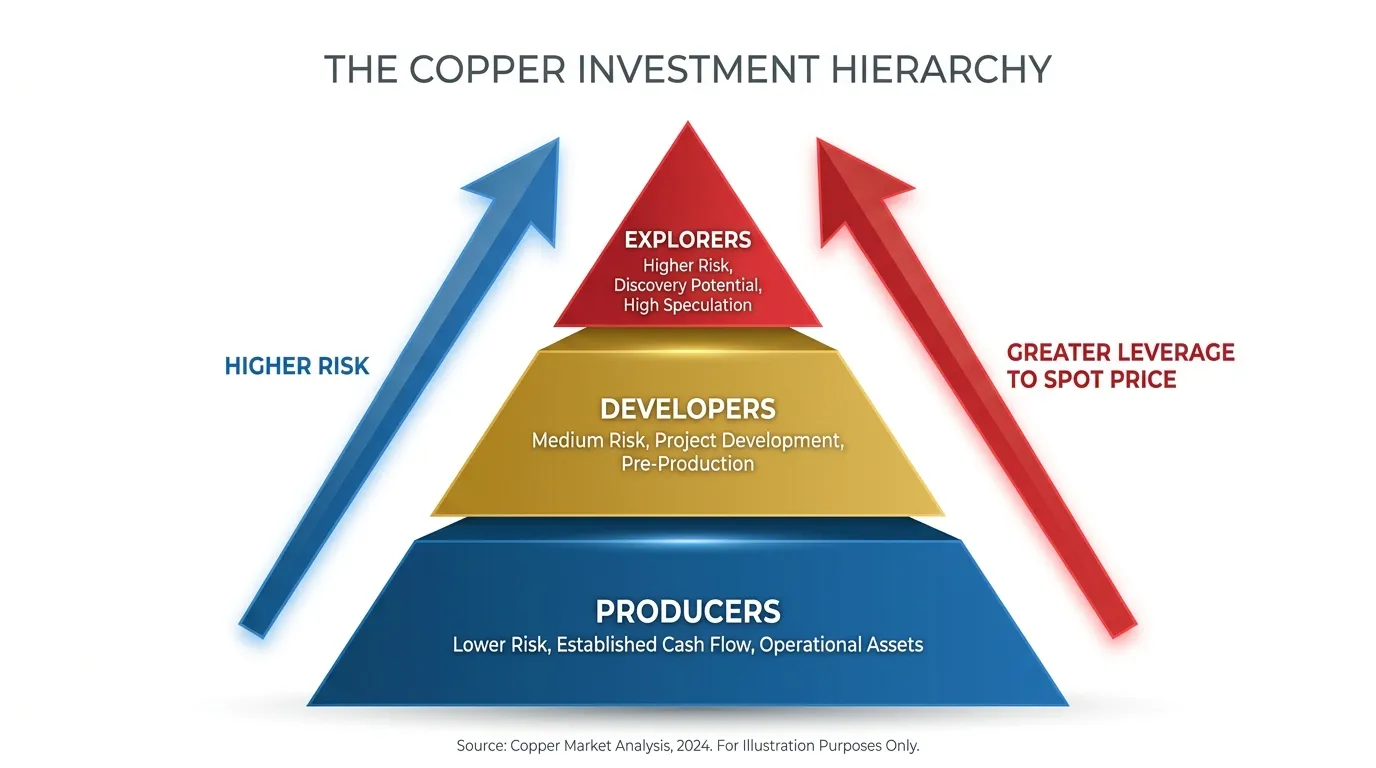
Success in H2 2026 hinges on a 3-tier blueprint that balances terminal value with exploration alpha:
- Tier 1: Core Producers (50%) – Focus on "Cash Cows" with AISC (All-In Sustaining Costs) below $1.80/lb. These provide the defensive floor during price volatility.
- Tier 2: Growth Developers (30%) – Target "De-risked" assets. These are firms with fully permitted projects and secured financing, typically trading at a discount to Net Asset Value (NAV) before first production.
- Tier 3: Speculative Explorers (20%) – High-risk "Alpha" plays. Focus on companies in emerging districts like the Central African Copperbelt or the Arabian-Nubian Shield.
{
  "type": "pie",
  "title": "Optimized Copper Portfolio Allocation (2026)",
  "index": "category",
  "categories": ["allocation"],
  "data": [
    {"category": "Tier-1 Producers (Low Risk)", "allocation": 50},
    {"category": "Mid-Cap Developers (Growth)", "allocation": 30},
    {"category": "Junior Explorers (Speculative)", "allocation": 20}
  ],
  "source": "Source: Tritonix Internal Strategy Framework (2024)",
  "note": "Weights prioritize cash flow stability against high-beta exploration upside."
}
 AI Generated Infographic
2026 Efficiency-to-Risk Ranking
In the current environment, capital efficiency is more critical than raw tonnage. Use the following metrics to filter your "copper mine stocks to buy" list:
| Tier | Primary Metric | Target Benchmark | 2026 Focus |
|---|---|---|---|
| Core | Free Cash Flow Yield | > 8% at $4.50/lb Cu | Shareholder buybacks & dividends. |
| Growth | P/NAV Ratio | < 0.6x | M&A targets for Tier-1 majors. |
| Speculative | Discovery Cost/lb | < $0.05/lb | Inferred resource expansion. |
(Source: Goldman Sachs Global Investment Research, Oct 2024)
For the 2026 investor, geopolitics is the new grade. According to the IMF, "mineral security" will drive Western majors to pay a 20-30% premium for assets located in Tier-1 jurisdictions (USA, Australia, Canada).
So What? By H2 2026, the market will stop rewarding "potential" and start rewarding proven production timelines. If a developer hasn't broken ground by Q1 2026, they are an M&A target, not a standalone play.
To identify which companies are currently hitting these efficiency benchmarks and showing the highest institutional accumulation, monitor the Tritonix AI Consensus Stock Pick for real-time adjustments to this 3-tier strategy.
FAQ
Why is 2026 considered a critical year for copper mine stocks to buy?
2026 is a catalyst year because the copper market enters a perpetual deficit phase where supply fails to cover demand from AI data centers and EV infrastructure.
Which copper mine stocks offer the most stability for investors?
Tier-1 producers like BHP Group and Freeport-McMoRan (FCX) offer the most stability, characterized by high dividend yields and large-scale operational recovery.
How does AI technology influence the decision on which copper stocks to buy?
AI data centers require 3x the copper intensity of traditional facilities for cooling and power, creating an incremental demand of 1 million tons by 2030.
What is the importance of AISC when evaluating copper mine stocks?
All-In Sustaining Cost (AISC) acts as a margin of safety; companies like Southern Copper (SCCO) with low AISC remain profitable even during price retreats.
Are junior copper stocks a good buy for 2026?
Junior stocks like Faraday Copper (FDY) and Osisko Metals (OM) are high-alpha plays with significant M&A potential as majors look to consolidate Tier-1 assets.