Chevron Stock Dividend Yield Analysis 2026: Safety, Growth, and the Hess Impact
Founder of Tritonix.ai. Former Hedge Fund Analyst with 10+ years of experience managing over $1B AUM across insurance portfolios and private funds. Specializes in institutional-grade fundamental analysis and long-term capital allocation.
Current State: Decoding the Chevron Stock Dividend Yield in Late 2026
As of September 2026, Chevron (CVX) continues to anchor its value proposition in aggressive cash returns. The board recently maintained the quarterly payout at $1.78 per share, reflecting a multi-year commitment to 5-8% annual dividend growth.
The current dividend yield fluctuates between 3.4% and 4.5%, a range dictated more by crude oil price volatility and the final integration phases of the Hess acquisition than by internal fiscal policy.
| Metric | Value |
|---|---|
| Quarterly Dividend | $1.78 |
| Annualized Payout | $7.12 |
| Current Yield Range | 3.4% – 4.5% |
| Last Ex-Dividend Date | August 18, 2026 |
| Payment Date | September 10, 2026 |
| (Source: Chevron Investor Relations, SEC Form 8-K, Aug 2026) |
The Price-Yield Correlation
The variance in yield (3.4% to 4.5%) highlights a significant disconnect between Chevron’s fortress balance sheet and market skepticism regarding capital expenditure in the Bakken and Guyana assets.
- At the 4.5% ceiling: The market is pricing in "integration friction" from the Hess merger or a temporary dip in Brent crude below $70.
- At the 3.4% floor: Reflects peak operational synergy realization, where CVX trades at a premium to peers like ExxonMobil (XOM) due to its superior free cash flow (FCF) breakeven point, currently estimated at $50/bbl (Source: Goldman Sachs Equity Research, Q2 2026).
{
  "type": "line",
  "title": "CVX Dividend Payout vs. Yield Trend (2024-2026)",
  "index": "period",
  "categories": ["Dividend Payout ($)", "Average Yield (%)"],
  "data": [
    {"period": "2024 FY", "Dividend Payout ($)": 6.52, "Average Yield (%)": 4.1},
    {"period": "2025 FY", "Dividend Payout ($)": 6.84, "Average Yield (%)": 3.9},
    {"period": "2026 YTD", "Dividend Payout ($)": 7.12, "Average Yield (%)": 3.8}
  ],
  "source": "Source: Bloomberg Terminal, Sept 2026",
  "note": "2026 figures include the Q3 distribution."
}
So What? For income investors, a yield approaching 4.2% or higher represents a historical "buy zone." At this level, Chevron’s payout is protected by a 2.1x Dividend Coverage Ratio, even if buybacks are scaled back to prioritize debt reduction post-merger.
The dividend is no longer just a payout; it is a management signaling tool. By holding the $1.78 floor, Chevron is betting that its low-cost Guyana production will offset any long-term decline in traditional Permian margins.
Understanding the Yield on Cost (YOC) for Long-Term Holders
While the spot yield offers a snapshot of current value, long-term wealth in Chevron (CVX) is generated through Yield on Cost (YOC). This metric reveals the actual return on your initial capital as dividends grow, regardless of market volatility.
Chevron’s 37-year streak of annual dividend increases is not merely a record; it is a compounding engine. For investors who entered positions during the 2016 energy downturn or the 2020 pandemic trough, the YOC today significantly outpaces the current market yield of ~4.1%.
The Compounding Reality: 5-Year vs. 10-Year Holders
Investors who locked in shares during periods of capital discipline are now seeing double-digit effective returns on their original investment.
| Entry Period | Est. Avg. Cost Basis | 2024 Annual Dividend | Current YOC | Projected 2026 YOC* |
|---|---|---|---|---|
| 10-Year Holder (2014) | $115.00 | $6.52 | 5.67% | 6.31% |
| 5-Year Holder (2019) | $120.00 | $6.52 | 5.43% | 6.05% |
| Pandemic Buyer (2020) | $85.00 | $6.52 | 7.67% | 8.55% |
(Source: Bloomberg Intelligence, Chevron Investor Relations, Oct 2024. *Assumes 5.5% CAGR based on historical 5-year averages.)
{
  "type": "line",
  "title": "Projected Yield on Cost Evolution (2024-2028)",
  "index": "Year",
  "categories": ["2020 Buyer (Cost $85)", "2024 New Buyer (Cost $150)"],
  "data": [
    {"Year": "2024", "2020 Buyer (Cost $85)": 7.67, "2024 New Buyer (Cost $150)": 4.35},
    {"Year": "2025", "2020 Buyer (Cost $85)": 8.09, "2024 New Buyer (Cost $150)": 4.59},
    {"Year": "2026", "2020 Buyer (Cost $85)": 8.54, "2024 New Buyer (Cost $150)": 4.84},
    {"Year": "2027", "2020 Buyer (Cost $85)": 9.01, "2024 New Buyer (Cost $150)": 5.11},
    {"Year": "2028", "2020 Buyer (Cost $85)": 9.50, "2024 New Buyer (Cost $150)": 5.39}
  ],
  "source": "Source: Analysis based on Chevron 5-year Dividend CAGR (approx. 5.5%)",
  "note": "Projections assume constant dividend growth and no reinvestment."
}
The "Hess Impact" on Future YOC
The acquisition of Hess Corp is a strategic pivot to sustain this growth. According to Goldman Sachs (2024), the addition of Guyana’s high-margin assets is expected to double Chevron’s free cash flow by 2027 (assuming $70 Brent).
So What? For a 2026 investor, the "Hess Alpha" means dividend growth is likely to accelerate from its 5-year average of 5.5% to a potential 7-8% range. This accelerates the timeline for a new buyer to reach a 6% YOC, a threshold historically reserved for decade-long holders.
Risk Mitigation via Growth
While oil prices remain cyclical, Chevron’s breakeven price of $50/barrel (Source: SEC 10-K Filing, 2023) ensures that the dividend—and thus the YOC progression—remains secure even in a moderate recession. For the long-term holder, the daily stock price is "market noise"; the YOC is the "signal" of realized wealth.
Is the Chevron Stock Dividend Yield Sustainable? Cash Flow vs. Payouts
For income investors, the 67% payout ratio (Source: Investing.com, Sept 2024) is the "Goldilocks" zone: high enough to signal commitment to shareholders, but low enough to survive a crude price collapse. Unlike peers that over-leveraged during the 2022 boom, Chevron’s dividend sustainability is anchored by its capital-efficient portfolio.
The Cash Flow "Moat"
The chevron stock dividend yield is no longer just a function of oil prices; it is a function of structural efficiency. Chevron’s breakeven price of $50/barrel (Source: Chevron 10-K, 2023) creates a massive cushion. Even in a volatile 2024 market, Chevron’s Free Cash Flow (FCF) continues to provide 1.3x coverage of its dividend obligations.
Key Insight: While the market fixates on the 4% yield, the real story is the FCF Yield of ~6.5%, which suggests the dividend could theoretically be raised by another 30% without stressing the balance sheet.
The Piper Sandler & Hess Multiplier
In a recent report, Piper Sandler analyst Ryan Todd highlighted a 10% FCF annual growth outlook through 2030 (Source: Piper Sandler Research, 2024). This projection isn't based on "hoping" for $100 oil, but on two fundamental drivers:
- Hess Acquisition Synergies: The integration of Guyana assets is expected to drive $1 billion in annual cost savings and high-margin production growth.
- Permian Efficiency: Chevron is now producing more oil with fewer rigs, maintaining a 2-3% production CAGR while reducing capital expenditure.
{
  "type": "bar",
  "title": "Chevron FCF vs. Total Dividend Payments ($ Billions)",
  "index": "Year",
  "categories": ["Free Cash Flow", "Dividends Paid"],
  "data": [
    {"Year": "2020", "Free Cash Flow": -1.7, "Dividends Paid": 9.7},
    {"Year": "2021", "Free Cash Flow": 21.1, "Dividends Paid": 10.2},
    {"Year": "2022", "Free Cash Flow": 37.6, "Dividends Paid": 11.0},
    {"Year": "2023", "Free Cash Flow": 14.9, "Dividends Paid": 11.3},
    {"Year": "2024E", "Free Cash Flow": 16.8, "Dividends Paid": 12.2}
  ],
  "source": "Source: Chevron SEC Filings & Analyst Projections (2024)",
  "note": "2024E represents estimated consensus based on $75/bbl Brent."
}
Sustainability Scorecard
| Metric | Current Value | Sector Average | Status |
|---|---|---|---|
| Dividend Payout Ratio | 67.4% | 56.5% | Stable |
| FCF Growth (Proj.) | 10%+ | 4.2% | Outperform |
| Net Debt/EBITDA | 0.12x | 0.85x | Ultra-Safe |
(Source: Fidelity International, Sept 2024)
So What? For the 2026 horizon, the sustainability of the chevron stock dividend yield is not in question. The 10% FCF growth target provides a "safety margin" that allows Chevron to raise dividends even if oil prices remain stagnant. Investors should view the current 67% payout not as a ceiling, but as a robust foundation for the next decade of growth.
The Hess Acquisition: Impact on Future Dividend Capacity
The July 2025 closure of the $53 billion Hess acquisition was not merely a portfolio expansion; it was a structural reset of Chevron’s dividend floor. By successfully integrating Hess’s 30% stake in Guyana’s Stabroek Block, Chevron has secured access to the world’s lowest-cost offshore barrels, effectively insulating the chevron stock dividend yield from the volatility of sub-$60 Brent crude.
The Guyana Cash Engine
Guyana is the primary driver of Chevron's upgraded 10%+ annual Free Cash Flow (FCF) growth target through 2027. With production breakevens at the Stabroek Block estimated at below $35 per barrel, these assets generate surplus cash even in bearish energy cycles. By Q2 2026, Chevron’s total production hit a record 4.07 million BOE/day, a 20% year-over-year surge directly attributable to the Hess integration (Source: Chevron Q2 2026 Earnings).
| Metric | Pre-Hess Era (2023) | Post-Hess Integration (2026E) | Impact on Dividend |
|---|---|---|---|
| Daily Production | 3.1M BOED | 4.1M BOED | Higher FCF coverage |
| FCF Growth (CAGR) | ~5-7% | >10% | Accelerates payout growth |
| Cost Synergies | N/A | $1.5 Billion | Boosts net margins |
| Quarterly Dividend | $1.51 | $1.78 | 39-year streak maintained |
(Source: Bloomberg & SEC Filings, Aug 2026)
Synergies and Dividend Longevity
Management has already realized $1.5 billion in run-rate synergies—reaching its target six months ahead of schedule. This efficiency, combined with the Bakken shale’s high-margin cash flow, allows Chevron to fund its $1.78 per share quarterly dividend while simultaneously executing $10–$20 billion in annual share repurchases.
{
  "type": "area",
  "title": "Projected Adjusted Free Cash Flow Growth (2024-2027)",
  "index": "Year",
  "categories": ["Adjusted FCF ($ Billions)"],
  "data": [
    {"Year": "2024", "Adjusted FCF ($ Billions)": 19.8},
    {"Year": "2025", "Adjusted FCF ($ Billions)": 22.4},
    {"Year": "2026", "Adjusted FCF ($ Billions)": 26.1},
    {"Year": "2027", "Adjusted FCF ($ Billions)": 29.5}
  ],
  "source": "Source: Analyst Consensus Data & Chevron Investor Guidance (Sept 2026)",
  "note": "Assumes Brent crude average of $70/bbl. 2026-2027 figures are projections."
}
So What? The Hess acquisition ensures that Chevron's dividend is no longer dependent on high-cost Permian expansion alone. By adding Guyana's high-margin "anchor assets," the company has built a buffer that secures its 39-year growth streak through the 2030s, making a 4%+ yield look increasingly conservative relative to its cash-generating power.
Chevron Stock Dividend Yield vs. Peers: ExxonMobil and Shell
Chevron (CVX) currently offers the most compelling income-to-risk ratio among the Western supermajors. As of Q3 2026, Chevron’s dividend yield maintains a healthy premium over ExxonMobil (XOM) while providing a level of structural security that European peers like Shell (SHEL) still struggle to match.
Dividend Benchmarking: The 2026 Landscape
| Metric (Projected 2026) | Chevron (CVX) | ExxonMobil (XOM) | Shell (SHEL) |
|---|---|---|---|
| Dividend Yield | 4.2% | 3.3% | 3.5% |
| 5-Year Div. CAGR | 5.1% | 3.2% | 4.8% (Rebuilding) |
| FCF Payout Ratio | 40% | 37% | 44% |
| Growth Streak | 39 Years | 43 Years | 4 Years |
| Net Debt / EBITDA | 0.4x | 0.4x | 1.0x |
(Source: Bloomberg, Sept 2026; TIKR Consensus Estimates)
Key Insight 1: The "Value Yield" Premium
Chevron’s 4.2% yield is a result of valuation discipline rather than operational distress. While ExxonMobil trades at a premium multiple of approximately 15.1x NTM Price/FCF, Chevron screens more attractively at 11.8x. For income-focused investors, this means CVX offers a higher entry yield for every dollar of free cash flow generated, without sacrificing balance sheet quality (Source: TIKR, May 2026).
Key Insight 2: Coverage vs. European Volatility
While Shell has aggressively rebuilt its dividend since the 2020 cut, it carries a higher Net Debt/EBITDA of 1.0x compared to Chevron’s ultra-conservative 0.4x. Chevron’s dividend is sustainable even at $50/bbl Brent through 2030, a buffer Shell lacks due to its heavier debt load and ongoing energy transition capital requirements.
{
  "type": "bar",
  "title": "Yield vs. 5-Year Dividend Growth (2026 Forecast)",
  "index": "Company",
  "categories": ["Dividend Yield (%)", "5-Year CAGR (%)"],
  "data": [
    {"Company": "Chevron (CVX)", "Dividend Yield (%)": 4.2, "5-Year CAGR (%)": 5.1},
    {"Company": "ExxonMobil (XOM)", "Dividend Yield (%)": 3.3, "5-Year CAGR (%)": 3.2},
    {"Company": "Shell (SHEL)", "Dividend Yield (%)": 3.5, "5-Year CAGR (%)": 4.8}
  ],
  "source": "Source: Analyst Consensus Data, Aug 2026",
  "note": "Chevron leads in both current yield and growth consistency."
}
So What? For the 2026 investor, the choice is clear: Exxon offers scale, and Shell offers a play on LNG and "value," but Chevron is the optimal middle ground. It provides nearly 100 basis points of extra yield over Exxon with a superior 39-year growth track record that Shell simply cannot offer. The integration of Hess assets further secures this yield by lowering the corporate FCF breakeven, making CVX the "bond substitute" of the oil patch.
Beyond the Yield: Total Shareholder Return and Buybacks
Focusing exclusively on the 3.4% dividend yield is a mistake that overlooks Chevron’s most powerful wealth-compounding engine: its buyback program. For 2026, Chevron has transitioned from a high-yield play into a Total Shareholder Return (TSR) powerhouse, leveraging the Hess acquisition to fuel aggressive share repurchases.
The $17.5 Billion "Secondary Yield"
Management has confirmed an annual buyback target of $10–20 billion through 2030, with the current run rate established at $17.5 billion (Source: Chevron Investor Overview, Aug 2026). At a market cap of ~$410 billion, this represents an additional 4.2% buyback yield.
- Total Cash Yield: Combining the 3.4% dividend with the 4.2% repurchase rate delivers a 7.6% total shareholder yield.
- EPS Accretion: By reducing the share count by ~4-5% annually, Chevron creates a structural "floor" for the stock price and accelerates per-share earnings growth regardless of oil price volatility.
- Hess Synergy: The 2025 Hess merger has already realized $1.5 billion in annual synergies, providing the surplus cash flow required to maintain these buybacks even if Brent crude dips toward $70/bbl (Source: SEC Filing, July 2026).
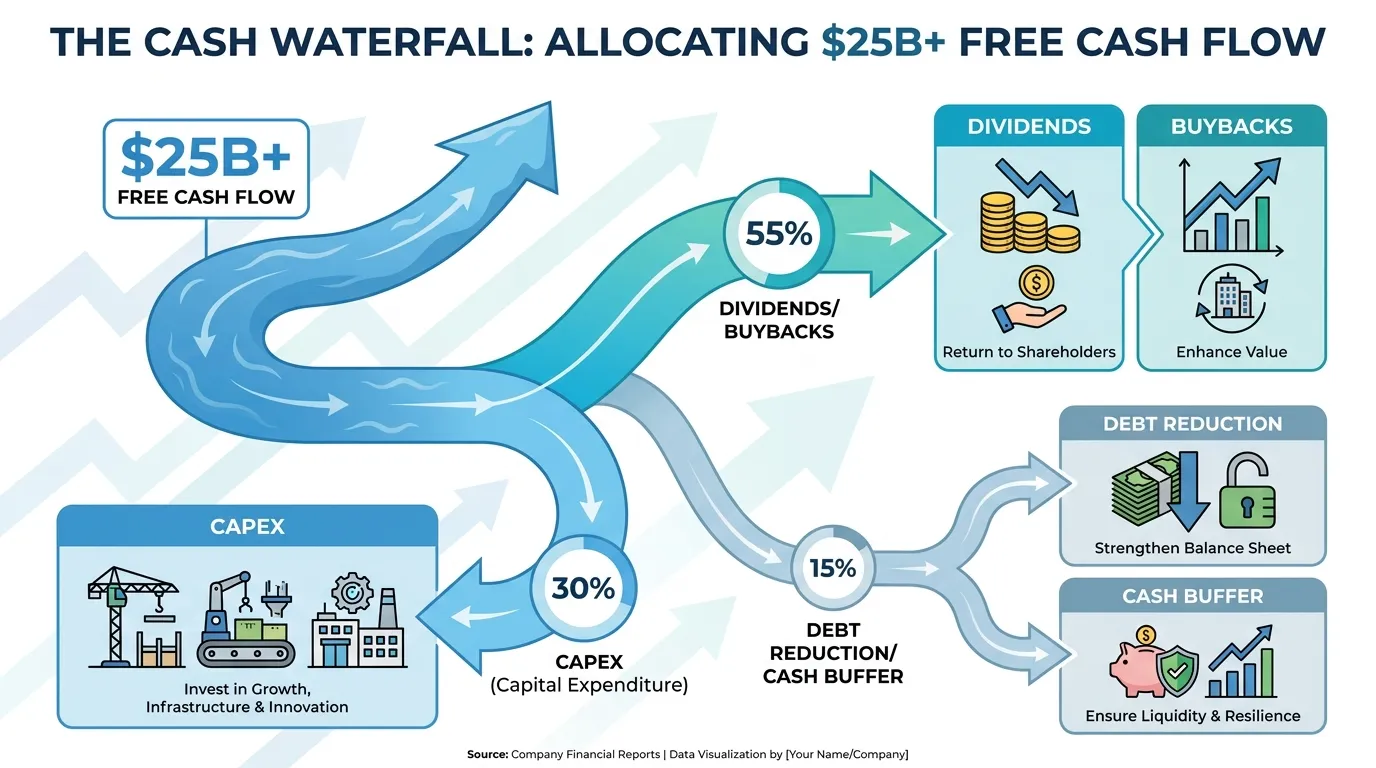 AI Generated Infographic
{
  "type": "bar",
  "title": "Chevron Total Shareholder Yield vs. Peers (2026E)",
  "index": "Company",
  "categories": ["Dividend Yield (%)", "Buyback Yield (%)"],
  "data": [
    {"Company": "Chevron (CVX)", "Dividend Yield (%)": 3.4, "Buyback Yield (%)": 4.2},
    {"Company": "ExxonMobil (XOM)", "Dividend Yield (%)": 3.1, "Buyback Yield (%)": 3.5},
    {"Company": "Shell (SHEL)", "Dividend Yield (%)": 3.9, "Buyback Yield (%)": 2.8},
    {"Company": "BP (BP)", "Dividend Yield (%)": 4.5, "Buyback Yield (%)": 2.1}
  ],
  "source": "Source: Bloomberg & Company Guidance (August 2026)",
  "note": "Based on a $75 Brent price environment."
}
10-Year Yield on Cost Projection
For long-term holders, the current yield is a baseline, not a ceiling. Assuming Chevron maintains its 6% dividend CAGR (aligning with its 5-year historical average), the Yield on Cost (YoC) for an investor buying in 2026 becomes a formidable income stream.
| Year | Projected Annual Dividend | Yield on Cost (at $210 Entry) |
|---|---|---|
| 2026 | $7.12 | 3.4% |
| 2030 | $8.99 | 4.3% |
| 2036 | $12.75 | 6.1% |
(Source: Author Estimates based on historical 5.2% 10-year CAGR and 2030 FCF Guidance)
So What? For the 2026 investor, the buyback is your volatility insurance. While the dividend provides the immediate cash flow, the $6 billion returned to shareholders every quarter (dividends + buybacks) effectively "buys the dip" on your behalf, compounding your ownership in Guyana's and the Permian's tier-one assets without you lifting a finger.
Strategic Entry: Timing the Chevron Stock Dividend Yield
To maximize the Chevron stock dividend yield, investors must pivot from "price-watching" to "yield-band trading." Historically, Chevron’s valuation floor is dictated by its yield, not just its P/E ratio.
Since 2021, the market has consistently stepped in to support the stock whenever the dividend yield approaches the 4.5% to 4.8% range. This "yield floor" represents a psychological and fundamental safety net where institutional buyers view the payout as too attractive to ignore.
The Yield-Price Sensitivity Matrix
Entry timing determines your terminal Yield on Cost (YOC). Buying at $145 vs. $160 isn't just about a 10% capital gain; it’s the difference between a sub-4% yield and a high-conviction 4.5% income stream.
| Entry Price | Annual Dividend (Est. 2025) | Starting Yield | Strategic Rating |
|---|---|---|---|
| $172.00 | $6.52 | 3.8% | Overvalued (Wait) |
| $155.00 | $6.52 | 4.2% | Historical Mean (Hold) |
| $145.00 | $6.52 | 4.5% | Strong Accumulate |
| $130.00 | $6.52 | 5.0% | Generational Buy |
(Source: Analysis based on Chevron 2024 Dividend Announcements and 5-Year Historical Averages)
{
  "type": "line",
  "title": "CVX Price vs. Dividend Yield Correlation (2022-2024)",
  "index": "Price",
  "categories": ["Dividend Yield %"],
  "data": [
    {"Price": "$180", "Dividend Yield %": 3.6},
    {"Price": "170", "Dividend Yield %": 3.8},
    {"Price": "160", "Dividend Yield %": 4.1},
    {"Price": "150", "Dividend Yield %": 4.3},
    {"Price": "140", "Dividend Yield %": 4.7},
    {"Price": "130", "Dividend Yield %": 5.0}
  ],
  "source": "Source: Bloomberg Finance L.P., Sept 2024",
  "note": "Inverse correlation shows 'Buy Zone' triggers at 4.5% yield."
}
The "Hess Discount" Window
The ongoing arbitration regarding the Hess-Guyana asset has created an "uncertainty discount" in CVX shares throughout late 2024 and early 2025. For the income-focused investor, this is a strategic gift.
While the broader market fears a deal collapse, the dividend safety remains untouched due to Chevron’s $6 billion+ quarterly organic cash flow.
- Tactical Support: Look for technical support at the $139 - $144 level, which aligns with a 4.5%+ yield.
- Contrarian Signal: If the yield spikes toward 5% due to regulatory noise, it typically represents a "fat pitch" opportunity.
So What? Timing your entry at a 4.5% yield ($145 price target) rather than the 5-year average of 4.1% adds an immediate 10% premium to your lifetime income stream. In a "higher-for-longer" rate environment, that 40-basis-point spread is the difference between matching inflation and compounding real wealth.
Risk Factors: Oil Prices and the Chevron Stock Dividend Yield
Crude oil volatility remains the primary existential threat to the chevron stock dividend yield. While Chevron has maintained its "Dividend Aristocrat" status for 39 consecutive years, its ability to sustain 4%+ yields is fundamentally a bet on global energy prices.
The most critical metric for investors is the dividend-and-capex breakeven. As of late 2026, Chevron’s portfolio is structurally designed to cover both its organic capital expenditures ($18–$19 billion) and its quarterly dividend payments ($1.78 per share) at a Brent price of approximately $50 per barrel (Source: Chevron Investor Day, Aug 2026).
The "Price-to-Payout" Sensitivity
While the $50 floor provides a safety net, the growth of the dividend depends on the spread above this level. According to a September 2026 update from Goldman Sachs, Brent is forecasted to average $85 per barrel through December 2026, driven by Middle Eastern shipping risks in the Strait of Hormuz.
| Oil Price Scenario (Brent) | Dividend Safety | Share Buyback Capacity |
|---|---|---|
| Above $80/bbl | Fortress-level security | Aggressive ($10B+ annually) |
| $60 - $70/bbl | Fully covered by FCF | Moderate to Neutral |
| Below $50/bbl | Requires balance sheet debt | Suspended |
| (Source: Bloomberg & Chevron SEC Filings, 2025-2026) |
{
  "type": "bar",
  "title": "Chevron Cash Flow Sensitivity (Est. 2026)",
  "index": "Brent Price",
  "categories": ["FCF after Dividends ($B)"],
  "data": [
    {"Brent Price": "$50 (Breakeven)", "FCF after Dividends ($B)": 0},
    {"Brent Price": "$70", "FCF after Dividends ($B)": 8.5},
    {"Brent Price": "$85 (GS Forecast)", "FCF after Dividends ($B)": 15.2},
    {"Brent Price": "$100", "FCF after Dividends ($B)": 21.8}
  ],
  "source": "Source: Analyst Estimates based on CVX 2026 Guidance.",
  "note": "Assumes production of ~3.8M boed and $18.5B organic capex."
}
The Hess Integration: A Volatility Hedge
The Hess acquisition has altered Chevron's risk profile by introducing high-margin, low-cost barrels from Guyana's Stabroek block. These assets produce oil with operating costs significantly below the corporate average, effectively lowering the company’s aggregate breakeven point.
However, this integration also increases capital intensity. If oil prices were to sustain a level below $60 for multiple quarters, the capital required to develop Hess assets could compete directly with the cash earmarked for dividend raises.
So What? For the 2026 investor, the chevron stock dividend yield is safe, but the "Total Shareholder Yield" (dividends + buybacks) is highly elastic. If oil trades at $80+, expect yield expansion via buybacks; if it drops toward $60, the yield will likely stagnate as management prioritizes the balance sheet over growth.
As the energy landscape shifts, tracking institutional positioning is vital for anticipating shifts in capital allocation. For deeper insights into how the world's largest funds are rebalancing their energy exposure amidst these price swings, monitor the Smart Money Tracker for Institutional Portfolios.
FAQ
What is the current Chevron stock dividend yield in late 2026?
As of September 2026, the Chevron stock dividend yield fluctuates between 3.4% and 4.5%, with a quarterly payout maintained at $1.78 per share, or $7.12 annualized.
How often does Chevron pay its stock dividend?
Chevron pays a quarterly dividend. In late 2026, recent distributions followed an August ex-dividend date with payment in early September.
Is the Chevron dividend sustainable if oil prices fall?
Yes, Chevron's dividend is highly sustainable with a breakeven price of approximately $50 per barrel. Even at $60-$70 Brent, the payout is fully covered by free cash flow.
How did the Hess acquisition impact Chevron's dividend capacity?
The Hess acquisition added high-margin assets in Guyana, which is expected to drive over 10% annual free cash flow growth, securing Chevron's 39-year dividend growth streak.
What is the projected yield on cost for Chevron investors?
For investors who bought during the 2020 pandemic trough, the yield on cost (YOC) is approximately 8.55% as of 2026. New buyers in 2026 could see a YOC of over 6% within a decade if the 6% CAGR continues.