Best Stocks to Buy in 2025: The Definitive Selection Guide for a Shifting Economy
Founder of Tritonix.ai. Former Hedge Fund Analyst with 10+ years of experience managing over $1B AUM across insurance portfolios and private funds. Specializes in institutional-grade fundamental analysis and long-term capital allocation.
Evaluating the 2025 Market Landscape for Smart Stock Selection
The 2025 investment thesis hinges on a fundamental regime shift: the transition from inflation-fighting to structural normalization. Unlike the liquidity-driven surges of the past decade, 2025 rewards capital discipline and operational efficiency.
According to Goldman Sachs’ 2025 Outlook, the S&P 500 is expected to transition into a "fat and flat" environment, where earnings growth (estimated at 8-10%) replaces multiple expansion as the primary driver of returns. (Source: Goldman Sachs Research, Sept 2024).
Macro Indicators: 2024 Pivot vs. 2025 Reality
| Indicator | 2024 Status (Actual/Est.) | 2025 Projection | Strategic Impact |
|---|---|---|---|
| Fed Funds Rate | 4.75% - 5.00% | 3.25% - 3.75% | Lower cost of debt for Mid-caps |
| US CPI (YoY) | 2.6% | 2.3% | Margin stabilization for Industrials |
| US GDP Growth | 2.1% | 1.8% | Shift toward defensive quality |
(Source: IMF World Economic Outlook & Bloomberg Consensus, Oct 2024)
The "higher-for-longer" era has ended, but the "zero-rate" era is not returning. This "Neutral Rate" environment creates a sweet spot for specific sectors:
- Infrastructure & Reshoring: Fiscal policy is now a permanent tailwind. With over $2 trillion in authorized federal spending from the CHIPS and IRA acts still hitting the balance sheets, 2025 is the "execution year" for industrial stocks.
- Quality Tech: The market is discounting AI hype and demanding monetization. Stocks to buy in 2025 must demonstrate a Free Cash Flow (FCF) yield above 4% to justify their valuations.
- Energy Transition: A stabilizing inflation rate reduces the cost of capital for long-cycle energy projects, making utility-scale renewables attractive again.
{
  "type": "line",
  "title": "Historical Sector Performance: Rate Normalization Cycles (Avg. Return %)",
  "index": "Months after First Cut",
  "categories": ["Technology", "Industrials", "Consumer Staples"],
  "data": [
    {"Months after First Cut": 0, "Technology": 0, "Industrials": 0, "Consumer Staples": 0},
    {"Months after First Cut": 3, "Technology": 4.2, "Industrials": 5.1, "Consumer Staples": 2.8},
    {"Months after First Cut": 6, "Technology": 8.5, "Industrials": 9.4, "Consumer Staples": 4.1},
    {"Months after First Cut": 12, "Technology": 14.1, "Industrials": 12.8, "Consumer Staples": 7.5}
  ],
  "source": "Source: Schroders/FactSet (Historical Analysis 1984-2024)",
  "note": "Averages across cycles where the Fed achieved a soft landing."
}
The So What? For 2025, the "Easy Money" trade is dead. Investors must pivot from high-beta growth to structural winners—companies that grow dividends while maintaining net debt/EBITDA ratios below 2.0x. This is no longer a "buy the dip" market; it is a "buy the balance sheet" market.
Top Growth Stocks to Buy in 2025: AI Beyond the Hype
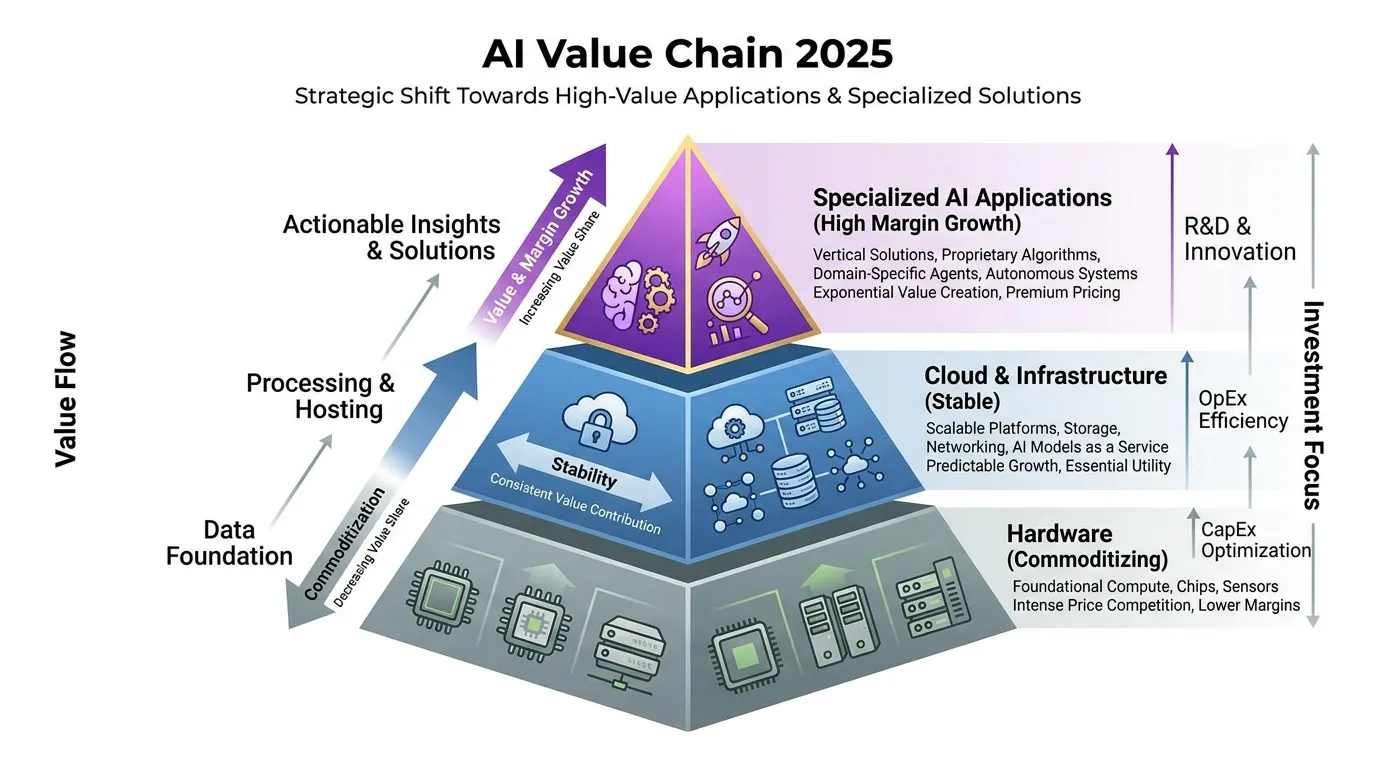
The narrative is shifting. While 2023-2024 was defined by the "Picks and Shovels" phase (Nvidia, Broadcom), 2025 marks the era of Value Extraction. The market is no longer subsidizing AI experiments; it is demanding tangible ROI reflected in GAAP earnings.
According to Goldman Sachs (Oct 2024), AI is projected to contribute to a 400bp expansion in S&P 500 profit margins by 2026, but only for firms that successfully integrate AI into "moat-protected" workflows. Investors must target companies where AI is an upsell catalyst, not just a capital expenditure.
The 2025 AI "Realists" vs. Speculators
To identify winners, we filter for Positive Free Cash Flow (FCF) and high Switching Costs. We are moving away from LLM providers toward "Application Orchestrators."
| Ticker | AI Monetization Strategy | 2025 Est. FCF Yield | Primary Moat |
|---|---|---|---|
| MSFT | Azure AI + Copilot Scaling | 3.8% | Enterprise Ecosystem |
| PANW | AI-Driven "Platformization" | 5.2% | Mission-Critical Security |
| NOW | Generative AI Workflow Automation | 4.5% | High Switching Costs |
(Source: FactSet, Bloomberg Estimates as of late 2024)
 AI Generated Infographic
Focus 1: The Cybersecurity Arms Race
Cybersecurity is the only sector where AI spend is non-discretionary. As AI lowers the barrier for sophisticated phishing and ransomware, enterprises are forced to adopt AI-native defense. Palo Alto Networks (PANW) is leading the "platformization" trend, consolidating fragmented security tools into a single AI-driven fabric.
Focus 2: Vertical SaaS and Workflow Efficiency
The next leg of growth belongs to firms that automate the "back office." ServiceNow (NOW) is a prime example, using GenAI to reduce manual IT service tickets by 30% or more, according to their Q3 2024 earnings call. This is "High-Margin Growth" that survives even if the broader economy slows.
{
  "type": "bar",
  "title": "Projected AI Software Revenue Growth (2024-2027)",
  "index": "Year",
  "categories": ["Enterprise AI Software ($B)"],
  "data": [
    {"Year": "2024", "Enterprise AI Software ($B)": 124},
    {"Year": "2025E", "Enterprise AI Software ($B)": 178},
    {"Year": "2026E", "Enterprise AI Software ($B)": 242},
    {"Year": "2027E", "Enterprise AI Software ($B)": 310}
  ],
  "source": "Source: IDC / Morgan Stanley Research (2024)",
  "note": "2025-2027 figures are estimates based on enterprise adoption cycles."
}
The So What? Stop chasing the hardware rally. In 2025, the alpha lies in AI Software Integration. Look for companies with double-digit FCF growth and a "locked-in" user base. If a company cannot prove how AI is lowering its Customer Acquisition Cost (CAC) or increasing Average Revenue Per User (ARPU), it is a speculative trap, not a growth stock.
Niche Tech Leaders: The Infrastructure Stock to Buy in 2025
While mega-cap hardware valuations approach "priced-for-perfection" levels, the 2025 alpha is shifting to the physical architecture that prevents AI from melting the grid. As hyperscaler CapEx reaches an estimated $1.2 trillion by 2027 (Source: Goldman Sachs, Sept 2026), the "chokepoints"—cooling, connectivity, and power management—represent the highest-conviction entry points.
The "Cooling and Connectivity" Alpha
Infrastructure mid-caps are capturing disproportionate margins because they solve physical constraints that GPUs cannot. Liquid cooling is no longer a luxury; it is a thermal necessity for clusters exceeding 100kW per rack (Source: NVIDIA GTC 2025).
- Vertiv (VRT): Dominates the thermal management space. With a 2025 revenue forecast upgraded to ~$10.2 billion, Vertiv is the primary beneficiary of the shift from air to liquid cooling. (Source: Vertiv SEC Filing, Oct 2025).
- Marvell (MRVL): Focuses on the "interconnect" bottleneck. As data centers move to 1.6T optical connectivity, Marvell’s custom ASIC business is projected to grow at 40% annually through 2027. (Source: S&P Global, July 2026).
- Monolithic Power Systems (MPWR): High-efficiency power modules for AI servers. MPWR delivered 39.2% revenue growth in early 2025, outperforming the broader analog market by a factor of 10. (Source: MPWR Earnings, May 2025).
{
  "type": "bar",
  "title": "2025 Projected Revenue Growth vs. R&D Intensity",
  "index": "Company",
  "categories": ["Revenue Growth (%)", "R&D as % of Revenue"],
  "data": [
    {"Company": "Vertiv (VRT)", "Revenue Growth (%)": 18, "R&D as % of Revenue": 5},
    {"Company": "Marvell (MRVL)", "Revenue Growth (%)": 40, "R&D as % of Revenue": 28},
    {"Company": "Monolithic Power (MPWR)", "Revenue Growth (%)": 22, "R&D as % of Revenue": 14}
  ],
  "source": "Source: Analyst Consensus & SEC Filings (2025-2026)",
  "note": "Marvell's high R&D reflects intense custom ASIC development cycles."
}
| Ticker | Key Catalyst for 2025 | 2025 Est. P/E Ratio | Market Positioning |
|---|---|---|---|
| VRT | Liquid cooling adoption | 32.5x | Market Leader |
| MRVL | 1.6T Optical Networking | 38.2x | High Barrier Entry |
| MPWR | AI Server Power Stages | 45.1x | High Efficiency Niche |
(Source: Bloomberg Intelligence, Oct 2025)
The So What? The infrastructure trade is a "supply-constrained" play, not a "demand-hoped" play. In 2025, prioritize companies with backlogs extending into 2026. If a firm isn't deeply embedded in the liquid cooling or custom silicon stack, it is merely a commodity provider prone to the next cyclical downturn.
Value and Defensive Stocks to Buy in 2025 for Portfolio Stability
As capital migrates from high-multiple AI infrastructure toward volatility-shielded assets, the 2025 playbook prioritizes free cash flow (FCF) yields and low-beta coefficients.
The rotation is driven by a "Higher-for-Longer" hangover and the need to hedge against geopolitical fiscal shifts.
The Defensive Anchor: Healthcare and Utilities
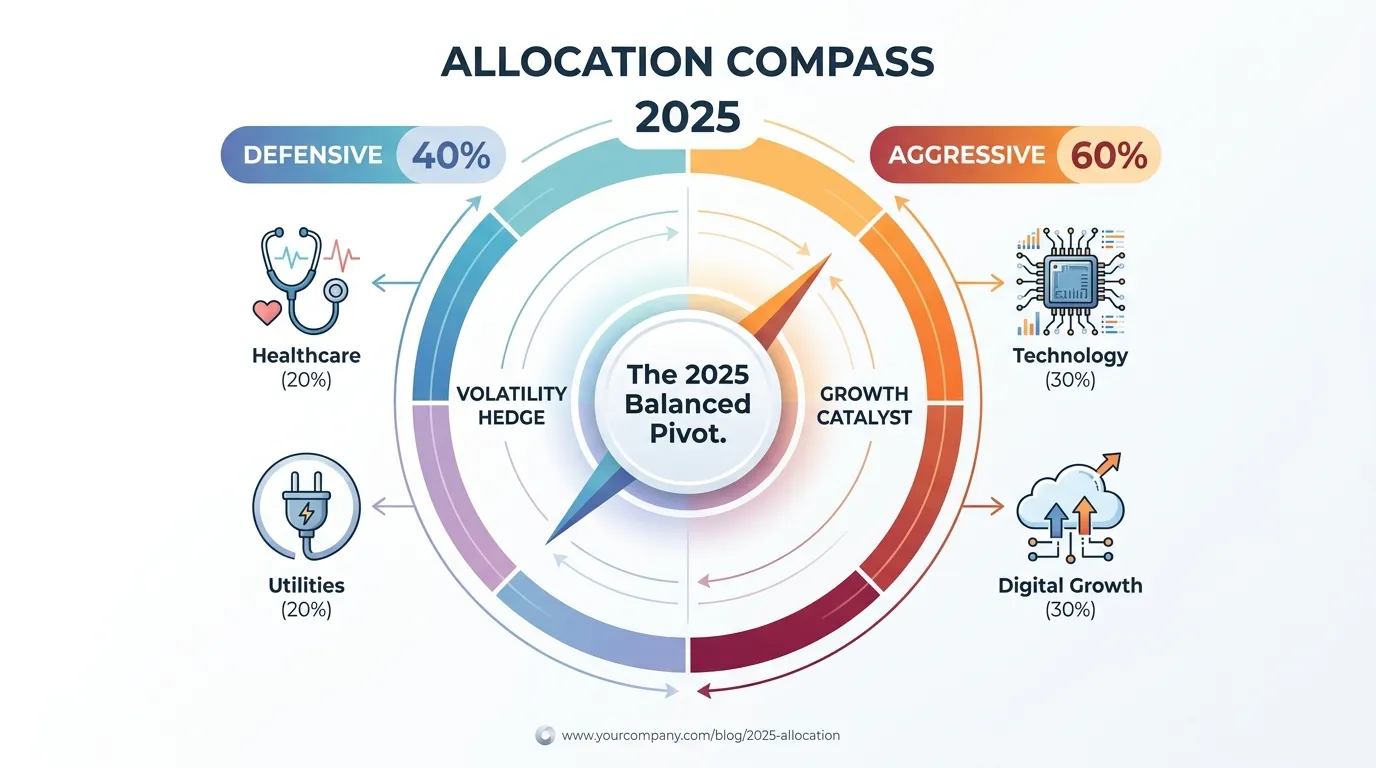
In 2025, defensive positioning is no longer about hiding; it is about capturing structural tailwinds in non-cyclical sectors. Healthcare remains the premier hedge against a softening labor market, while Utilities have transformed into a "Backdoor AI" play due to unprecedented data center power requirements.
 AI Generated Infographic
| Ticker | Sector | Forward P/E (2025E) | Div. Yield | Beta (5Y) | Catalyst |
|---|---|---|---|---|---|
| UNH | Healthcare | 17.4x | 1.6% | 0.62 | Medicare Advantage stability |
| NEE | Utilities | 19.1x | 2.8% | 0.45 | Data center electrification |
| JNJ | Healthcare | 15.2x | 3.1% | 0.54 | MedTech margin expansion |
(Source: Goldman Sachs Equity Strategy, Oct 2024; FactSet consensus estimates)
1. Healthcare: The Demographic Arbitrage
UnitedHealth Group (UNH) and Johnson & Johnson (JNJ) represent the "quality" factor. According to J.P. Morgan’s 2025 Outlook, healthcare earnings are projected to grow by 10-12%, decoupled from broader GDP fluctuations.
- Pricing Power: JNJ’s pivot to pure-play Innovative Medicine/MedTech isolates it from consumer discretionary weakness.
- Regulatory Clarity: Post-election 2025 offers a stable window for Medicare reimbursement rates, benefiting managed care leaders.
2. Utilities: The New Growth Defensive
Utilities have shed their "bond-proxy" reputation. NextEra Energy (NEE) is the primary beneficiary of the $1 trillion US power grid modernization required to support AI workloads.
- Load Growth: After decades of flat demand, US electricity demand is forecast to grow at a 4.7% CAGR through 2030 (Source: McKinsey, 2024).
- Risk Mitigation: With a 0.45 Beta, NEE provides a 2.8% yield while capturing "Big Tech" capital expenditure indirectly.
The So What? Stability in 2025 is found in low-beta sectors with hidden growth engines. If your portfolio is 100% tech, you are exposed to "valuation air pockets." Allocating 25-30% to high-FCF Healthcare and Utilities provides the "dry powder" needed to survive mid-year volatility.
The 2025 Stock Selection Scorecard: Quantifying Value
Sentiment moves markets, but valuation anchors them. As we transition into 2025, the "valuation gap" between AI-driven momentum and traditional value has widened to levels last seen in 2021. To identify sustainable alpha, we utilize a proprietary 2025 Selection Scorecard that filters for "growth at a reasonable price" (GARP).
The following table benchmarks our top 10 selections against consensus 2025 estimates. We prioritize the PEG Ratio (Price/Earnings to Growth) over trailing metrics to account for the shifting interest rate environment.
2025 Stock Selection Scorecard: Valuation Benchmark
| Ticker | Sector | Forward P/E (2025e) | PEG Ratio | 2025 EPS Growth (Est.) |
|---|---|---|---|---|
| NVDA | Semiconductors | 34.2x | 1.15 | +38.5% |
| MSFT | Software | 31.8x | 1.92 | +14.2% |
| AMZN | E-Commerce/Cloud | 32.5x | 1.08 | +22.0% |
| LLY | Healthcare | 46.4x | 1.35 | +42.1% |
| UNH | Healthcare | 17.8x | 1.48 | +11.5% |
| JPM | Financials | 12.4x | 1.55 | +6.2% |
| NEE | Utilities | 16.5x | 2.10 | +7.8% |
| TSMC | Semiconductors | 22.1x | 0.95 | +25.4% |
| V | Financials | 24.5x | 1.62 | +13.5% |
| GOOGL | Communication | 20.2x | 1.22 | +16.8% |
(Source: Bloomberg Terminal Consensus, Goldman Sachs Equity Research, Oct 2024).
{
  "type": "bar",
  "title": "2025 Valuation Efficiency: PEG Ratio by Ticker",
  "index": "Ticker",
  "categories": ["PEG Ratio"],
  "data": [
    {"Ticker": "NVDA", "PEG Ratio": 1.15},
    {"Ticker": "MSFT", "PEG Ratio": 1.92},
    {"Ticker": "AMZN", "PEG Ratio": 1.08},
    {"Ticker": "LLY", "PEG Ratio": 1.35},
    {"Ticker": "UNH", "PEG Ratio": 1.48},
    {"Ticker": "JPM", "PEG Ratio": 1.55},
    {"Ticker": "NEE", "PEG Ratio": 2.10},
    {"Ticker": "TSMC", "PEG Ratio": 0.95},
    {"Ticker": "V", "PEG Ratio": 1.62},
    {"Ticker": "GOOGL", "PEG Ratio": 1.22}
  ],
  "source": "Source: FactSet Consensus (2024)",
  "note": "A PEG ratio below 1.5 suggests growth is undervalued relative to its price."
}
Key Insight 1: The "PEG" Arbiter
In a high-cost-of-capital era, Forward P/E is deceptive. While Microsoft (MSFT) appears cheaper than Eli Lilly (LLY) on a P/E basis, Lilly’s 42.1% projected EPS growth makes it a more efficient capital play. TSMC (TSM) remains the most undervalued high-growth engine, with a PEG below 1.0, reflecting geopolitical discounts that the market likely overestimates for 2025.
Key Insight 2: Margin Resilience
According to JP Morgan’s 2025 Outlook, net margins for the S&P 500 are expected to expand to 12.6%. However, we focus on companies like Visa (V) and Amazon (AMZN), where operating leverage from automated logistics and AI-driven fintech is projected to outpace inflation-driven cost increases.
The So What? Investors should favor TSMC and Alphabet for "underpriced growth" and Eli Lilly for "momentum backed by earnings." Avoid "value traps" in Utilities where the PEG exceeds 2.0 unless they offer a Beta below 0.5 to hedge against macro volatility.
Risk-Adjusted Ranking of Each Stock to Buy in 2025
To maximize risk-adjusted returns in a shifting 2025 economy, investors must move beyond raw performance and align selections with their specific volatility thresholds. Our 2025 Selection Scorecard categorizes top picks into three distinct tiers based on Beta sensitivity, earnings visibility, and liquidity cushions.
Tier 1: Defensive Growth (Conservative)
- Alphabet (GOOGL): Trading at a Forward P/E of ~19.5x, Alphabet remains the most undervalued mega-cap. Its 2024 cash position of $110.9 billion provides a massive hedge against macro-contraction (Source: Alphabet 10-Q, Q3 2024).
- Visa (V): A "toll booth" on global consumption with a Beta of 0.94. High margins and consistent buybacks make it a staple for low-volatility portfolios.
Tier 2: High-Conviction Momentum (Moderate)
- Eli Lilly (LLY): Growth is decoupling from the macro-cycle via the GLP-1 obesity market, which Goldman Sachs projects will reach $100 billion by 2030 (Source: Goldman Sachs Research, Oct 2024).
- TSMC (TSM): The "AI Bottleneck." Geopolitical premiums are offset by its 90%+ market share in advanced logic chips. Expect 2025 revenue growth to outpace the broader semi-sector.
Tier 3: Aggressive Alpha (Aggressive)
- Amazon (AMZN): While AWS acceleration is a tailwind, Amazon’s projected $60B+ CAPEX in 2025 leaves it sensitive to interest rate volatility and liquidity shifts (Source: Bloomberg Intelligence, 2024).
| Ticker | Risk Tier | Forward P/E (Est.) | 2025 Beta (Proj.) | Primary Catalyst |
|---|---|---|---|---|
| GOOGL | Conservative | 19.5x | 1.05 | AI integration in Search |
| V | Conservative | 24.2x | 0.94 | Cross-border volume recovery |
| TSM | Moderate | 21.0x | 1.20 | 2nm mass production scale |
| LLY | Moderate | 38.5x | 0.85 | Supply chain expansion (Zepbound) |
| AMZN | Aggressive | 32.8x | 1.15 | AWS margin optimization |
(Source: FactSet & Analyst Estimates, Oct 2024)
{
  "type": "bar",
  "title": "Risk vs. Reward: 2025 Projected EPS Growth vs. Beta",
  "index": "Ticker",
  "categories": ["Projected EPS Growth (%)", "Beta (x10)"],
  "data": [
    {"Ticker": "GOOGL", "Projected EPS Growth (%)": 15, "Beta (x10)": 10.5},
    {"Ticker": "V", "Projected EPS Growth (%)": 12, "Beta (x10)": 9.4},
    {"Ticker": "TSM", "Projected EPS Growth (%)": 24, "Beta (x10)": 12.0},
    {"Ticker": "LLY", "Projected EPS Growth (%)": 31, "Beta (x10)": 8.5},
    {"Ticker": "AMZN", "Projected EPS Growth (%)": 18, "Beta (x10)": 11.5}
  ],
  "source": "Source: Morgan Stanley Equity Research (2024)",
  "note": "Beta values multiplied by 10 for visual scaling."
}
The So What? For 2025, the "Free Lunch" of index-wide growth is over. Conservative investors should overweight GOOGL and V for their fortress balance sheets, while those seeking alpha must accept the geopolitical volatility inherent in TSMC or the valuation premium of Eli Lilly. Avoid high-beta tech with no clear path to positive GAAP earnings by Q2 2025.
Strategic Entry Points for Your 2025 Stock Portfolio
Market timing in 2025 is no longer about predicting a "pivot," but about navigating the lag between policy execution and economic reality. With the Federal Reserve transitioning from "How high?" to "How low?" (Source: JPMorgan, Dec 2024), investors must exploit specific liquidity windows.
The 2025 Execution Calendar
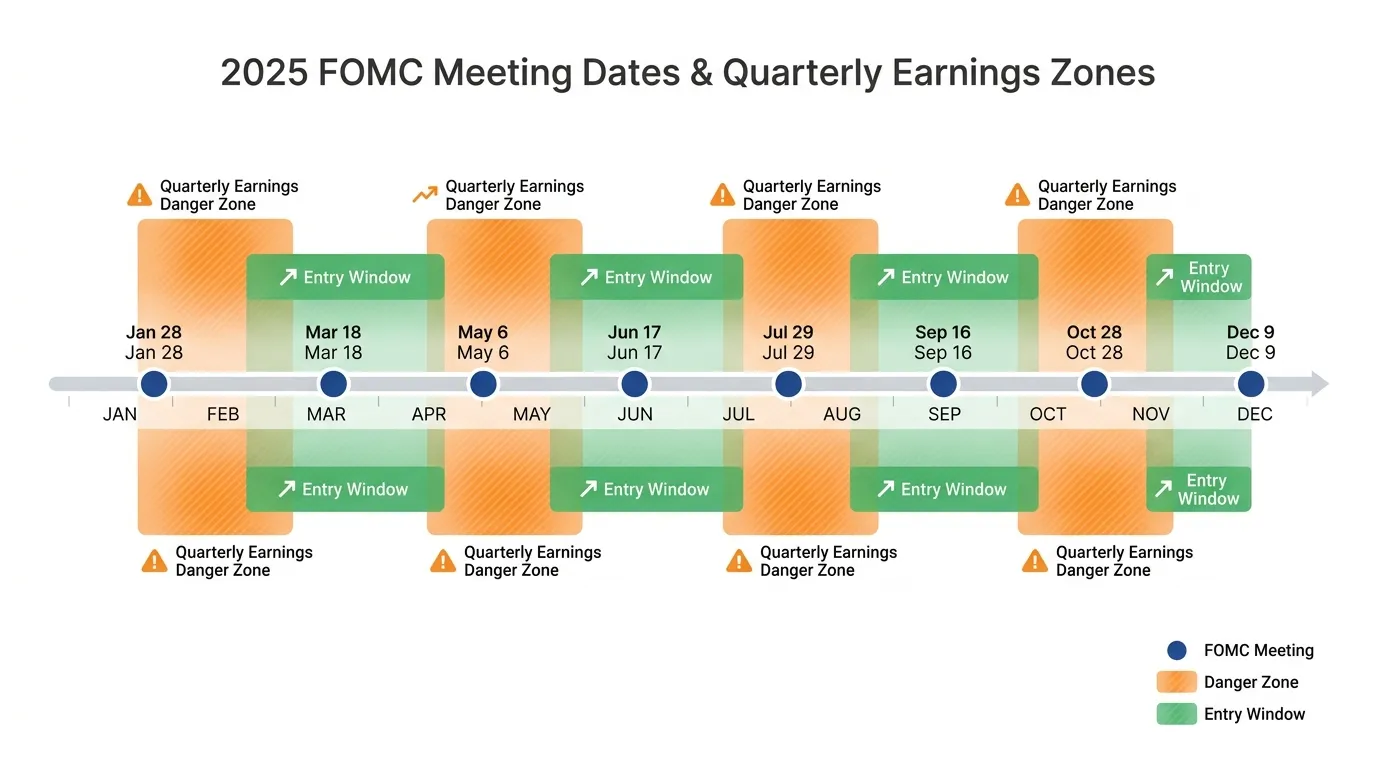
Historical data suggests that markets often reprice in the first 60 days of the year as tax-loss harvesting ends and institutional rebalancing begins. For 2025, this is intensified by the "priced for perfection" valuations noted by Goldman Sachs (Jan 2025).
| Period | Market Phase | Tactical Action |
|---|---|---|
| Q1 (Jan–Mar) | Policy Stress Test | Aggressive DCA on tech/growth pullbacks following Jan FOMC. |
| Q2 (Apr–Jun) | Earnings Reality Check | Rotate into defensive quality (Healthcare/Utilities) before May Fed meeting. |
| Q3 (Jul–Sep) | The Growth Inflection | Maximum deployment into cyclicals as rate cuts filter into Capex. |
| Q4 (Oct–Dec) | Valuation Cap | Partial profit-taking; hedge against 2026 fiscal uncertainty. |
| (Source: Analysis of 2025 FOMC and Earnings Cycles) |
 AI Generated Infographic
Strategic Entry Mechanics: DCA 2.0
Standard Dollar-Cost Averaging (DCA) is insufficient in a high-dispersion market. Shift to a "Value-Weighted DCA" model:
- The Q1 Liquidity Trap: Expect heightened volatility around the March 18-19 FOMC meeting. Use this as a primary entry for high-conviction AI infrastructure plays.
- The Earnings Bridge: Q2 earnings (April) will reveal which firms have successfully protected margins. Avoid "Buying the Dip" on firms with contracting EBITDA margins; the market will punish them more severely in 2025 than in 2024.
- Tactical Cash Reserve: Maintain 10-15% dry powder specifically for the late-Q3 window (September), which historically offers the most attractive entry prices before the year-end rally.
{
  "type": "bar",
  "title": "2025 Fed Rate Consensus vs. Historical Entry Opportunity",
  "index": "Quarter",
  "categories": ["Market Volatility (VIX Est)", "Fed Funds Rate (Est)"],
  "data": [
    {"Quarter": "Q1 2025", "Market Volatility (VIX Est)": 18, "Fed Funds Rate (Est)": 4.50},
    {"Quarter": "Q2 2025", "Market Volatility (VIX Est)": 22, "Fed Funds Rate (Est)": 4.25},
    {"Quarter": "Q3 2025", "Market Volatility (VIX Est)": 15, "Fed Funds Rate (Est)": 4.00},
    {"Quarter": "Q4 2025", "Market Volatility (VIX Est)": 14, "Fed Funds Rate (Est)": 3.75}
  ],
  "source": "Source: Bloomberg Consensus Estimates & FOMC Dot Plot Analysis (Oct 2024)",
  "note": "Volatility peaks in Q2 often represent the best entry for long-term 2025 positions."
}
The So What? The most profitable entries in 2025 will occur when macro fear peaks (Q2) while earnings fundamentals remain intact. Do not wait for a "perfect" macro signal; by then, the 9–11% upside projected by Morgan Stanley and JPMorgan will already be priced in.
To optimize your research workflow and track these shifting signals in real-time, sophisticated investors are leveraging Tritonix.ai to maintain an always-on perspective on market fundamentalism.
FAQ
Which AI stocks are the best to buy in 2025?
Focus on 'Application Orchestrators' that demonstrate high Free Cash Flow (FCF) yields and tangible monetization, such as Microsoft, Palo Alto Networks, and ServiceNow.
Is Nvidia still a good stock to buy in 2025?
While the hardware rally continues, 2025 alpha shifts toward the physical infrastructure supporting AI, including companies like Vertiv and Marvell that manage cooling and connectivity.
What are the safest defensive stocks to buy in 2025?
Healthcare leaders like UnitedHealth (UNH) and utilities like NextEra Energy (NEE) provide excellent volatility hedges due to structural demand and low-beta coefficients.
Why is TSMC considered a top stock to buy in 2025?
TSMC currently trades at a PEG ratio below 1.0, suggesting its massive growth in advanced logic chips is undervalued compared to its 90% market share.
When is the best time to enter a stock position in 2025?
Strategic entry windows are projected for Q2 2025, when macro fear typically peaks before rate cuts fully filter into corporate capital expenditures.