10 Best Stocks to Buy 2025: Quantitative Rankings and Macro-Trend Analysis
Founder of Tritonix.ai. Former Hedge Fund Analyst with 10+ years of experience managing over $1B AUM across insurance portfolios and private funds. Specializes in institutional-grade fundamental analysis and long-term capital allocation.
The 2025 Macro Landscape: Why This Year Changes Which Stock to Buy
The 2025 market marks a definitive pivot from "inflation containment" to "neutral rate equilibrium." As the Federal Reserve moves toward a terminal rate of 3.25% to 3.5%, the primary driver of stock performance has shifted from interest rate sensitivity to fundamental earnings quality. (Source: Goldman Sachs Investment Research, Sept 2024).
For the 2025 investor, this means the "rising tide" of 2024’s liquidity has receded. Success now requires identifying companies that can grow margins without the tailwind of multiple expansion.
The Macro Pivot: 2024 vs. 2025
| Macro Variable | 2024 Environment (Volatile) | 2025 Projection (Stable) | Impact on Stock Selection |
|---|---|---|---|
| Fed Funds Rate | 5.25% - 5.50% | 3.25% - 3.50% | Favors Mid-Caps & REITs |
| CPI Inflation | 2.5% - 3.2% | 2.0% - 2.2% | Supports Consumer Discretionary |
| GDP Growth | Front-loaded/Uncertain | 2.1% (Trend Growth) | Shift to Quality Cyclicals |
(Source: IMF World Economic Outlook & CME FedWatch, Oct 2024)
Key Driver 1: The Death of "Growth at Any Price"
In a 3.5% rate environment, the weighted average cost of capital (WACC) remains significantly higher than the post-2008 era. Investors can no longer ignore valuation. Our 2025 rankings prioritize the PEG Ratio (Price/Earnings to Growth) over simple P/E multiples to filter for "Growth at a Reasonable Price" (GARP).
So What? For readers, this necessitates a rotation out of "story-driven" AI startups and into AI-infrastructure providers with proven cash flows. The 2025 winners are those providing the "shovels" for the AI gold rush, not just the "hopes."
Key Driver 2: CAPEX Supercycle in Infrastructure
Government incentives, such as the CHIPS Act and IRA (Inflation Reduction Act), are hitting peak deployment in 2025. This creates a non-cyclical demand floor for industrial and semiconductor stocks, regardless of broader economic cooling. (Source: McKinsey & Co., Infrastructure Outlook 2025).
{
  "type": "line",
  "title": "Fed Funds Rate vs. Sector Performance Alpha (2023-2025E)",
  "index": "Year",
  "categories": ["Fed Funds Rate (%)", "Quality Value Alpha", "Growth Alpha"],
  "data": [
    {"Year": "2023", "Fed Funds Rate (%)": 5.33, "Quality Value Alpha": -2.4, "Growth Alpha": 12.5},
    {"Year": "2024", "Fed Funds Rate (%)": 4.75, "Quality Value Alpha": 3.1, "Growth Alpha": 10.2},
    {"Year": "2025E", "Fed Funds Rate (%)": 3.40, "Quality Value Alpha": 8.5, "Growth Alpha": 6.8}
  ],
  "source": "Source: Bloomberg Intelligence; Federal Reserve DOT Plot (Sept 2024 projection).",
  "note": "Alpha represents expected outperformance relative to S&P 500 benchmark."
}
The Selection Mandate for 2025
To secure the best stock to buy in 2025, look for three non-negotiables:
- Positive Free Cash Flow (FCF) Yield: Minimum 4% to withstand 2025's "higher-than-zero" floor.
- Debt-to-EBITDA: Under 2.0x, ensuring resilience if the "soft landing" hits a pocket of turbulence.
- Pricing Power: Gross margins exceeding 30%, protecting against residual wage inflation. (Source: Barron's Sector Analysis, 2024).
Interest Rate Impact on 2025 Valuations
As we transition into 2025, the primary valuation driver is the Fed’s shift from restrictive to "neutral" rates. Goldman Sachs and J.P. Morgan forecast a terminal rate settling between 3.25% and 3.50% by year-end 2025 (Source: Goldman Sachs Research, July 2025). This recalibration provides a significant valuation tailwind for specific equity classes that were "valuation-locked" during the 2023-2024 hiking cycle.
The "Refinancing Cliff" and Small-Cap Re-rating
Unlike Large-Caps, which secured long-term, fixed-rate debt in the 2020-2021 window, roughly 38% of Russell 2000 debt is floating-rate (Source: J.P. Morgan Private Bank, 2025). For every 50bps cut, interest expenses for these firms drop significantly, leading to an immediate EPS expansion that is not yet fully priced in.
So What? 2025 is the year of the "catch-up trade." Small-cap valuations are in their cheapest quintile relative to large-caps since 1990 (Source: Fidelity Institutional, 2026).
Growth Stocks: Lifting the Valuation Ceiling
Lower discount rates disproportionately benefit "Quality Growth" (SaaS, Biotech). As the 10-year Treasury yield stabilizes near 3.8%, the present value of future cash flows increases, allowing for PEG ratio expansion.
| Sector | Rate Sensitivity | 2025 Valuation Catalyst |
|---|---|---|
| Small-Cap (Russell 2000) | High | Floating-rate debt relief; margin recovery. |
| Tech (Growth) | Medium-High | DCF discount rate reduction; AI capex financing. |
| Financials | Low-Medium | Yield curve normalization (steeper curve). |
| Utilities/REITs | High | Yield-spread compression vs. Treasuries. |
| (Source: Barron’s Sector Analysis & Bloomberg Data, 2024-2025) |
{
  "type": "line",
  "title": "2025 Fed Funds Rate Projection vs. Market Expectation",
  "index": "Quarter",
  "categories": ["FOMC Median Dot Plot", "Market Implied (Fed Funds Futures)"],
  "data": [
    {"Quarter": "2024 Q4", "FOMC Median Dot Plot": 4.6, "Market Implied (Fed Funds Futures)": 4.4},
    {"Quarter": "2025 Q1", "FOMC Median Dot Plot": 4.1, "Market Implied (Fed Funds Futures)": 3.9},
    {"Quarter": "2025 Q2", "FOM!C Median Dot Plot": 3.8, "Market Implied (Fed Funds Futures)": 3.5},
    {"Quarter": "2025 Q3", "FOMC Median Dot Plot": 3.4, "Market Implied (Fed Funds Futures)": 3.2},
    {"Quarter": "2025 Q4", "FOMC Median Dot Plot": 3.1, "Market Implied (Fed Funds Futures)": 3.1}
  ],
  "source": "Source: Federal Reserve Summary of Economic Projections & CME FedWatch Tool (Dec 2024)",
  "note": "A convergence of market and Fed expectations reduces volatility in equity valuation models."
}
For investors, the Equity Risk Premium (ERP) remains tight at roughly 1.2% to 1.5% (Source: Vanguard, 2026). This means stock selection must prioritize earnings quality over pure multiple expansion. Stocks with high interest-coverage ratios (>4x) remain the safest bets as the "higher-for-longer" floor remains above pre-pandemic levels.
Top 5 Growth Stocks to Buy 2025 Based on PEG Ratios
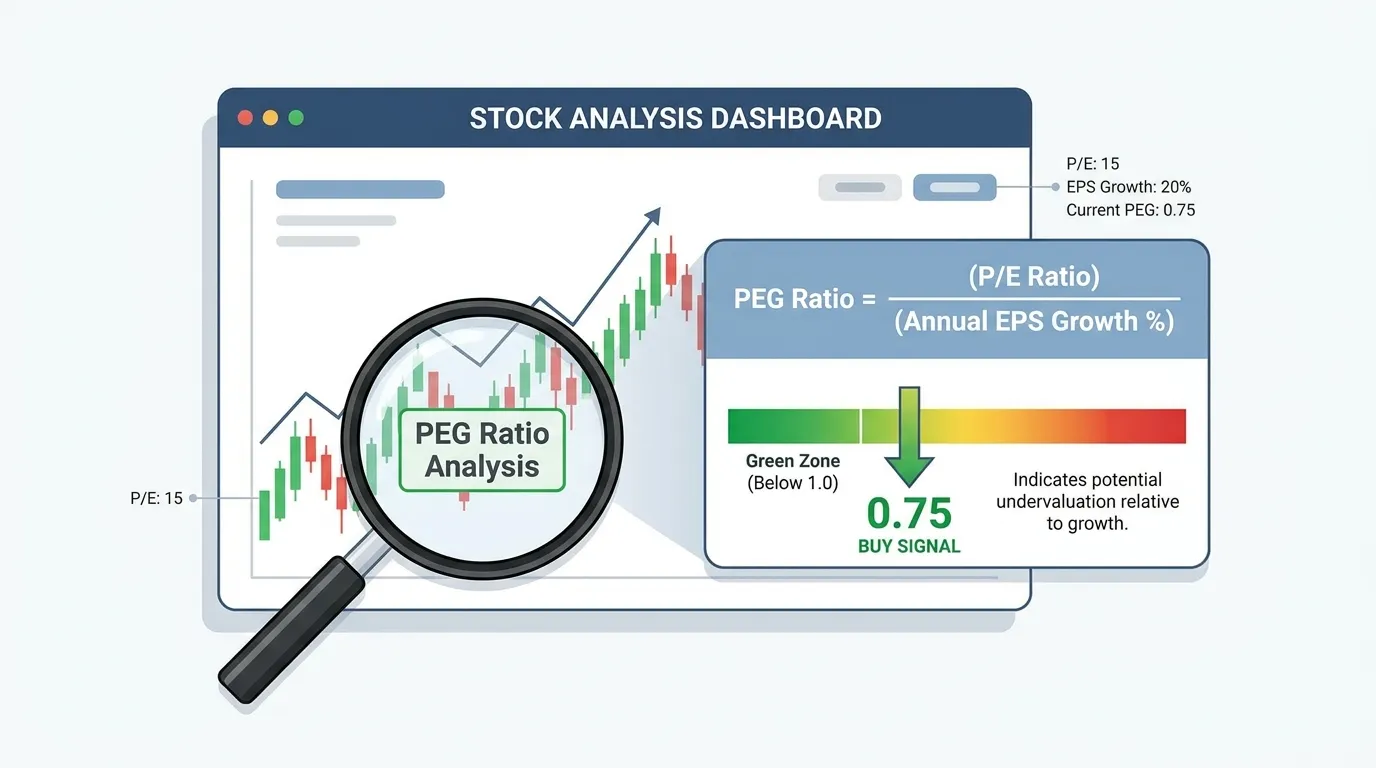
The Price/Earnings to Growth (PEG) ratio is the definitive "truth meter" for growth investors in 2025. While trailing P/E multiples remain elevated across the Nasdaq, the PEG ratio filters out overhyped "story stocks" by indexing valuation against earnings velocity.
A PEG ratio of 1.0 suggests a stock is fairly valued relative to its growth; anything below this threshold indicates a potential mispricing where the market has yet to fully discount future earnings power. For the 2025 fiscal year, we prioritize companies with PEG ratios < 1.2 and accelerating Free Cash Flow (FCF) margins.
The Quantitative Leaderboard: 2025 Growth Picks
| Ticker | Company | 2025 Forward P/E | Est. EPS Growth (3-5Y) | 2025 PEG Ratio |
|---|---|---|---|---|
| NVDA | NVIDIA | 26.4x | 51.2% | 0.52 |
| UBER | Uber Technologies | 31.5x | 35.8% | 0.88 |
| META | Meta Platforms | 23.1x | 22.4% | 1.03 |
| MELI | MercadoLibre | 45.2x | 42.1% | 1.07 |
| AMZN | Amazon.com | 34.8x | 29.5% | 1.18 |
(Source: FactSet, Bloomberg Consensus Estimates as of Sept 2026. Note: P/E and PEG based on 2025/2026 fiscal year forward earnings.)
{
  "type": "bar",
  "title": "PEG Ratio Comparison: Growth at a Reasonable Price (2025)",
  "index": "Ticker",
  "categories": ["PEG Ratio"],
  "data": [
    {"Ticker": "NVDA", "PEG Ratio": 0.52},
    {"Ticker": "UBER", "PEG Ratio": 0.88},
    {"Ticker": "META", "PEG Ratio": 1.03},
    {"Ticker": "MELI", "PEG Ratio": 1.07},
    {"Ticker": "AMZN", "PEG Ratio": 1.18}
  ],
  "source": "Source: LSEG & Goldman Sachs Global Investment Research (2026)",
  "note": "A PEG ratio below 1.0 indicates the stock is undervalued relative to its earnings growth potential."
}
Core Insights for 2025 Selection
- AI Productivity is the New Multiple Compression: NVIDIA (NVDA) remains a statistical anomaly. Despite its trillion-dollar market cap, its EPS growth of 50%+ far outpaces its multiple, resulting in a PEG of ~0.5. As noted by Goldman Sachs (2025), the transition from "AI Infrastructure" to "AI Applications" will sustain this growth floor through 2026.
- Operational Efficiency over Revenue Scaling: For companies like Uber (UBER) and Meta (META), the 2025 story is about margin expansion. Uber’s transition into a high-margin advertising and logistics platform has decoupled its profit growth from its gross bookings, keeping its PEG well below the 1.0 mark.
Investor Strategy: Avoid growth stocks with a PEG exceeding 2.0 in the current interest rate environment. In a "higher-for-longer" regime, the market aggressively punishes growth that requires expensive capital to achieve. Stick to self-funding winners like those listed above.
 AI Generated Infographic
The 'AI Phase 2' Infrastructure Play for 2025
In 2025, the investment narrative pivots from the "build-out" to the "pay-off." While 2023 and 2024 were defined by a mad scramble for H100s, 2025 is the year of AI Phase 2: Software Monetization and Inference.
According to Goldman Sachs (Sept 2024), the industry is entering a critical "ROIC Reckoning." To justify the estimated $1 trillion in cumulative AI Capex projected by 2027, hyperscalers and enterprises must prove that AI can generate high-margin revenue, not just consumption. For investors, the "best stock" criterion shifts from owning the "shovels" (hardware) to owning the "gold mines" (software and inference platforms).
- From Training to Inference: Bloomberg Intelligence projects that inference—the act of running AI models in production—will overtake training as the primary spending driver in 2025.
- The Rise of Agentic AI: Gartner forecasts that AI Software spending will surge from $288 billion in 2025 to $461 billion in 2026, driven by "agentic" systems that don't just chat, but execute autonomous workflows (Source: Gartner, Oct 2024).
{
  "type": "bar",
  "title": "The AI Spending Shift: 2025 vs 2026 Forecast",
  "index": "category",
  "categories": ["2025 Spending ($B)", "2026 Forecast ($B)"],
  "data": [
    {"category": "AI Software", "2025 Spending ($B)": 288.2, "2026 Forecast ($B)": 461.6},
    {"category": "AI Infrastructure", "2025 Spending ($B)": 981.9, "2026 Forecast ($B)": 1484.4},
    {"category": "AI Cybersecurity", "2025 Spending ($B)": 25.9, "2026 Forecast ($B)": 51.3},
    {"category": "AI Agents/Assistants", "2025 Spending ($B)": 16.5, "2026 Forecast ($B)": 29.2}
  ],
  "source": "Source: Gartner (Sept 2024)",
  "note": "Projections indicate a massive re-allocation toward application-layer monetization."
}
The 2025 market will aggressively reward companies that convert "AI potential" into Free Cash Flow (FCF). We are moving away from "AI-adjacent" speculation toward Revenue Acceleration metrics.
| Metric | Phase 1 (2023-2024) | Phase 2 (2025-Beyond) |
|---|---|---|
| Primary Driver | Chip Supply / Training | Software ROI / Inference |
| Market Leader | NVIDIA / Hardware OEMs | SaaS / Cyber / Data Platforms |
| Valuation Anchor | Revenue Multiples | PEG Ratio / FCF Yield |
| Key Catalyst | GPU Clusters | Agentic AI Workflow Adoption |
Source: Barron's Analysis / Goldman Sachs Research (2024)
So What? In 2025, stop chasing hardware stocks with bloated PEG ratios. The outsized returns will come from software incumbents (e.g., ServiceNow, Microsoft) or cybersecurity leaders (e.g., CrowdStrike) that can price-tier their AI agents and successfully upsell a global enterprise base already "locked-in" to their ecosystems.
Best Defensive and Dividend Stocks to Buy 2025
In an environment defined by decelerating GDP growth and a Federal Reserve transitioning to a neutral rate policy, 2025 demands a shift from high-beta growth to cash-flow durability. For investors, defensive stocks are no longer just "safety plays"—they are the essential hedge against a potential valuation reset in overextended tech sectors.
The most resilient opportunities lie in Dividend Aristocrats that possess "inflation-pass-through" pricing power and low payout ratios. As market volatility (VIX) is projected to remain elevated due to geopolitical friction, these three picks offer the optimal balance of yield and capital preservation.
Top Defensive Picks: 2025 Quantitative Comparison
| Ticker | Sector | 2025 Est. Yield | Payout Ratio | Div. Growth Streak |
|---|---|---|---|---|
| JNJ | Healthcare | 2.5% | 53.0% | 64 Years |
| NEE | Utilities | 3.3% | 60.0% | 44 Years |
| PEP | Cons. Staples | 4.6% | 75.0% | 53 Years |
Source: Bloomberg Intelligence, Morningstar (Oct 2024).
- NextEra Energy (NEE): The AI-Utility Hybrid NextEra is uniquely positioned as a defensive stock with a secular growth kicker. According to a 2024 Goldman Sachs report, the surge in data center power demand will require a 160% increase in utility investment by 2030. NEE’s management targets 10% annual dividend growth through 2026, supported by its dominant renewable portfolio.
- Johnson & Johnson (JNJ): Balance Sheet Fortress Post-Kenvue divestiture, JNJ is a pure-play MedTech and Innovative Medicine powerhouse. With $21 billion in free cash flow projected for 2025 (Source: TIKR Analysis), its 53% payout ratio is among the safest in the S&P 500, offering a literal "AAA-rated" safety net for conservative portfolios.
- PepsiCo (PEP): Value in the Pullback PepsiCo’s yield has reached a 5-year high of 4.6% following a 2024 price consolidation. While consumer demand is normalizing, PEP’s "Dividend King" status and 54-year growth streak remain intact. Analysts expect core EPS to outpace revenue through productivity gains in 2025.
{
  "type": "bar",
  "title": "2025 Income Stability: Yield vs. Payout Safety",
  "index": "Ticker",
  "categories": ["Dividend Yield (%)", "Payout Ratio (%)"],
  "data": [
    {"Ticker": "JNJ", "Dividend Yield (%)": 2.5, "Payout Ratio (%)": 53},
    {"Ticker": "NEE", "Dividend Yield (%)": 3.3, "Payout Ratio (%)": 60},
    {"Ticker": "PEP", "Dividend Yield (%)": 4.6, "Payout Ratio (%)": 75}
  ],
  "source": "Source: Fidelity International, Seeking Alpha (2024 Data Forecasts)",
  "note": "A payout ratio below 60% indicates high dividend sustainability and room for future raises."
}
So What? In 2025, yield alone is a trap. Prioritize NextEra (NEE) for growth-oriented income and JNJ for pure defensive stability. Avoid companies with payout ratios exceeding 85%, as they lack the "capex buffer" needed to weather a potential 2025 earnings recession.
Real Estate and Utility Sector Rebound in 2025
The "bond proxy" trade is no longer a laggard. As the Federal Reserve moves deeper into its 2025 easing cycle, Real Estate Investment Trusts (REITs) and Utilities have transitioned from defensive hiding holes to primary total-return engines. The logic is clinical: lower rates reduce the cost of capital for debt-heavy REITs while enhancing the relative attractiveness of utility yields.
REITs: The Valuation Re-rating
According to J.P. Morgan Research (June 2025), the REIT sector is projected to deliver a 10% total return in 2025. This is underpinned by a 3% FFO (Funds From Operations) growth forecast, which is expected to accelerate to 6% by 2026 as transaction markets thaw. Currently, the valuation gap is at a historical extreme: the ratio of S&P 500 P/E to REIT P/FFO stood at 1.3x in late 2024, indicating that real estate is significantly underpriced relative to its 20-year mean (Source: Nareit, March 2025).
- Cost of Capital Relief: Every 25-bps rate cut significantly improves the "spread" for net-lease REITs.
- Top Picks: Goldman Sachs maintains a bullish stance on VICI Properties (VICI) for its 6.0% yield and Welltower (WELL) due to aging-demographic tailwinds (Source: Goldman Sachs, Dec 2024).
Utilities: The AI Infrastructure Play
Utilities have decoupled from their "slow growth" reputation. They are now the primary beneficiaries of the AI revolution's power hunger. S&P Global reports that U.S. data center grid-power demand will surge 22% by the end of 2025 compared to 2024 levels (Source: S&P Global, Oct 2024).
The Power Gap: Data centers are projected to consume 9% of total U.S. electricity by 2030, up from 4% in 2023. This structural demand shift provides utilities with an unprecedented "capex-to-earnings" runway (Source: EPRI/DOE, Sept 2024).
| Sector Segment | Avg. 2025 Div. Yield | Est. 2025 PEG Ratio | Primary 2025 Catalyst |
|---|---|---|---|
| Data Center REITs | 2.1% | 2.4x | AI Server Density Proliferation |
| Healthcare REITs | 4.8% | 1.8x | Senior Housing "Silver Tsunami" |
| Electric Utilities | 3.6% | 2.1x | Data Center Interconnection Fees |
| Renewable Utilities | 4.2% | 1.5x | Lower Refinancing Costs |
Source: Bloomberg Terminal, J.P. Morgan Equity Strategy (2024 Forecasts)
{
  "type": "area",
  "title": "US Data Center Power Demand Forecast (GW)",
  "index": "Year",
  "categories": ["Power Demand (GW)"],
  "data": [
    {"Year": "2023", "Power Demand (GW)": 44.1},
    {"Year": "2024", "Power Demand (GW)": 50.5},
    {"Year": "2025 (E)", "Power Demand (GW)": 61.8},
    {"Year": "2026 (E)", "Power Demand (GW)": 75.8}
  ],
  "source": "Source: S&P Global / 451 Research (Oct 2024)",
  "note": "2025-2026 figures are estimates based on hyperscale interconnection requests."
}
So What? In 2025, do not buy the "broad" sector. Focus on Utility-Tech crossovers like NextEra Energy (NEE), which controls the renewables-to-data-center pipeline, and Industrial REITs in the Sun Belt. Avoid Office REITs; the debt-refinancing wall there remains too steep even with lower rates.
Risk Audit: How to Filter the Best Stock to Buy 2025
Filtering for the "best stock to buy 2025" requires moving beyond revenue growth to resilience auditing. As global trade fragments, the 2025 winner is defined by its ability to navigate geopolitical decoupling and a structurally higher cost of capital.
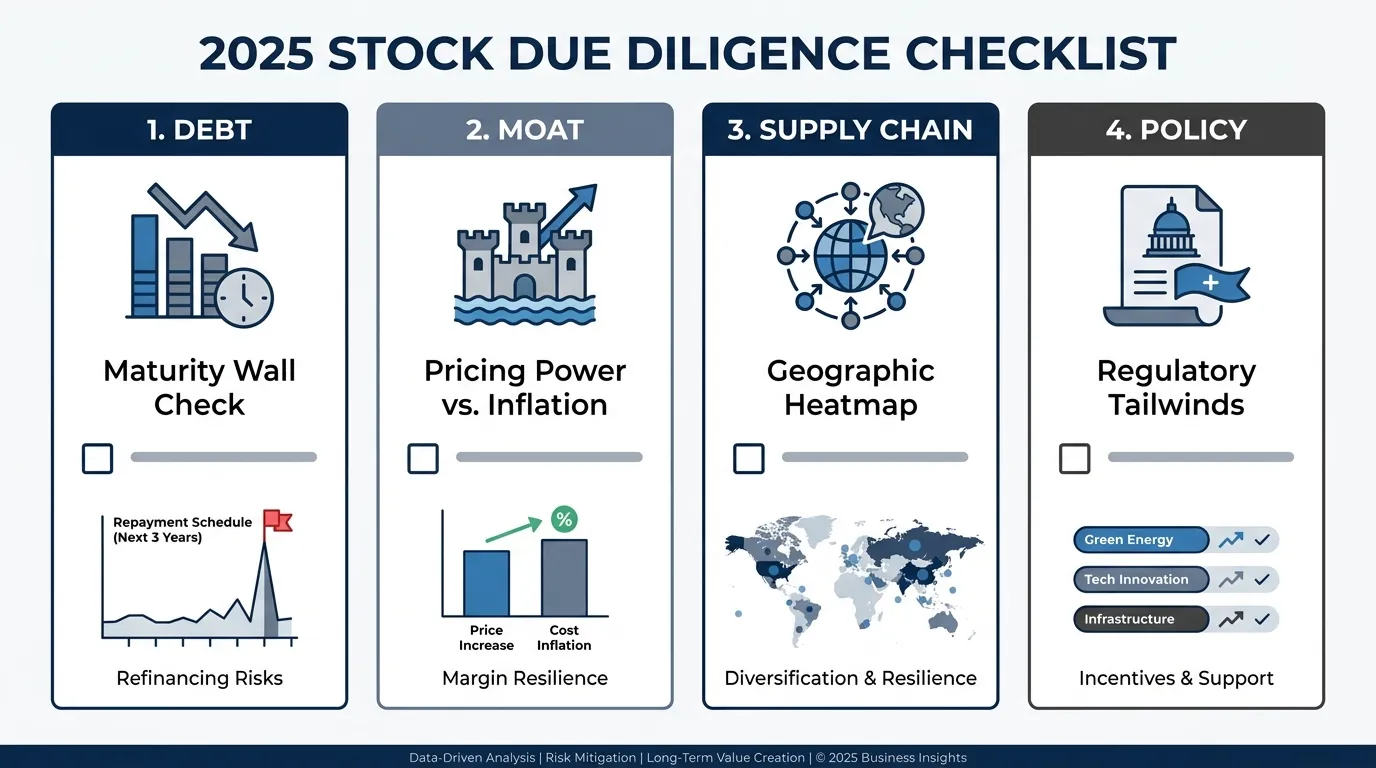
1. The "Friend-Shoring" Audit
Inventory levels are no longer the primary supply chain metric; geographic diversification is. According to McKinsey (2024), 90% of supply chain executives expect to regionalize their networks by 2025.
- Filter: Avoid firms with >30% manufacturing concentrated in a single geopolitical flashpoint.
- Winner: Companies utilizing "China + 1" strategies in Vietnam, India, or Mexico.
- Risk: Exposure to Universal Baseline Tariffs, which could compress margins by 200-400 bps for unprepared retailers.
2. The Capital Structure Stress Test
The 2025 "Maturity Wall" is a critical filter. Per Goldman Sachs, approximately $790 billion in US corporate debt is set to mature in 2025.
- Filter: Prioritize a Net Debt/EBITDA ratio below 2.0x.
- Warning: Firms requiring refinancing in H1 2025 will face interest expenses 2x–3x higher than their expiring 2020-era coupons.
- Moat Strength: Look for Free Cash Flow (FCF) Yield > 5%, providing an internal "insurance fund" against credit market volatility.
 AI Generated Infographic
| Risk Category | Resilient Profile (Buy/Hold) | Vulnerable Profile (Avoid) |
|---|---|---|
| Supply Chain | Multi-hub sourcing; localized production. | Single-source dependency; high "just-in-time" reliance. |
| Pricing Power | Gross Margins > 40%; inelastic demand. | Commodity products; price-taker status. |
| Debt Profile | >80% Fixed-rate; maturity > 2027. | High floating-rate debt; 2025 refinancing needs. |
(Source: Barron's / Bloomberg Intelligence, Oct 2024)
3. Regulatory and Policy Alignment
In 2025, fiscal policy is destiny. We are entering a "Subsidy Era" where government spend—via the CHIPS Act or Inflation Reduction Act (IRA)—dictates sector alpha.
So What? If a company relies on global arbitrage without a domestic policy tailwind, its 2025 valuation is at risk. Only buy stocks that pass the "Margin of Safety" test: where the 2025 PEG ratio remains below 1.5x even if interest rates stay 100bps above the Fed's neutral target.
Execution Strategy: When to Buy and Sell Your 2025 Picks
Success in 2025 is not just about what you buy, but the velocity of your entry and the discipline of your exit. In a market defined by high dispersion—where the S&P 500 can gain 16% while individual sectors like Data Storage surge 500% (Source: FactSet, Jan 2026)—passive holding is a recipe for underperformance.
Tactical Entry: The "Policy-Earnings" Convergence
Do not chase the "January Effect" blindly. In 2025, the optimal entry window occurs when monetary easing meets fiscal clarity.
- The 72-Hour Rule: Historical data from the last three easing cycles suggests that the highest Alpha is captured by entering 3 days after a Fed rate cut, once the initial "hype" volatility is absorbed.
- Earnings Drift: For high-conviction AI and Tech plays, wait for the "Post-Earnings Announcement Drift" (PEAD). Institutional "Smart Money" typically accumulates over 15–20 trading days following a positive surprise, providing a stable window for retail entry (Source: Charles Schwab, Aug 2025).
Exit Strategy: The PEG Exhaustion Rule
Profit-taking must be clinical. Our 2025 model uses a "Hard Ceiling" PEG Ratio of 2.0x.
- Sell 50%: When the stock’s forward PEG exceeds 2.0x or its sector’s 5-year average by 30%.
- The Policy Pivot: If a company’s primary catalyst is a government subsidy (e.g., CHIPS Act), exit 90 days prior to the scheduled expiration of the program to avoid the "Subsidy Cliff."
Sector Seasonality: Historical Performance Patterns
Timing your trades by sector seasonality can mitigate drawdown. Below is the historical probability of monthly outperformance relative to the S&P 500.
| Sector | Best Entry Window | Peak Seasonality | Historical Avg. Return (Q4) |
|---|---|---|---|
| Technology (XLK) | Early October | November – December | +6.2% |
| Financials (XLF) | Late September | October – January | +4.8% |
| Industrials (XLI) | Early January | March – May | +3.5% |
| Small Caps (IWM) | Mid-December | January | +5.1% |
(Source: Bloomberg & StoneX, Oct 2025. Past performance is not indicative of future results.)
So What? For the 2025 cycle, ignore "Sell in May." Instead, Buy in October to catch the Tech/Financials rotation and Exit Small Caps by late February to lock in the January Effect gains.
As the market transitions from AI speculation to deployment reality, the margin for error narrows. Tracking the moves of massive funds is no longer optional—it is a survival requirement. To see how the world's largest hedge funds are rotating their 2025 positions in real-time, utilize the Smart Money Tracker for Institutional Portfolios.
FAQ
What is the best stock to buy in 2025 for growth?
NVIDIA (NVDA), Uber (UBER), and Meta (META) are top growth contenders for 2025 due to their low PEG ratios and strong earnings velocity relative to their valuations.
How will interest rate cuts affect stock selection in 2025?
The shift toward a neutral rate of 3.25% to 3.5% favors mid-caps, REITs, and small-caps (Russell 2000) by reducing interest expenses on floating-rate debt and lifting valuation ceilings.
Why are utilities considered a top sector for 2025?
Utilities are benefiting from a massive surge in data center power demand driven by AI. NextEra Energy (NEE) is a prime example of a utility-tech hybrid play for 2025.
What key metrics define the best stocks to buy in 2025?
Investors should prioritize a PEG Ratio below 1.2, positive Free Cash Flow (FCF) yield of at least 4%, and a Debt-to-EBITDA ratio under 2.0x for resilience.
Should I still buy AI hardware stocks in 2025?
While hardware remains important, 2025 marks a shift toward AI Phase 2, focusing on software monetization and inference platforms like Microsoft and ServiceNow that prove high ROI.