Best Semiconductor ETF Guide 2026: Ranking the Top Funds for the AI & Reshoring Era
Specializes in alternative data and valuation models. Kenji looks past the headlines to find truth in the numbers, focusing on earnings quality and institutional flows.
The 3 Best Semiconductor ETF Leaders Compared: SMH, SOXX, and SOXQ
The battle for semiconductor supremacy in 2026 has distilled into a choice between three titans: SMH, SOXX, and SOXQ. While they share 80% of the same tickers, their indexing methodologies create vastly different risk-return profiles for the AI-driven "Reshoring Era."
The "Big Three" Comparison Table
| Ticker | Expense Ratio | 3-Year CAGR | Top 3 Holdings % | 30-Day Avg Volume (Shares) | Strategy |
|---|---|---|---|---|---|
| SMH | 0.35% | ~29.1% | ~38.5% | ~12.0M | High-Concentration Leaders |
| SOXX | 0.35% | ~24.0% | ~25.8% | ~31.8M | Modified Cap-Weighted |
| SOXQ | 0.19% | ~24.7% | ~26.1% | ~2.2M | Budget-Friendly "SOX" |
| (Source: Bloomberg & ETF Database, Nov 2024 - Nov 2026 Estimates) |
SMH: Concentration as a Feature, Not a Bug
For the aggressive investor, SMH (VanEck Semiconductor ETF) is the "Winner-Takes-Most" play. Its index allows for single-stock exposure of up to 20%, resulting in a heavy tilt toward Nvidia (NVDA) and TSMC (TSM).
In a market where AI infrastructure spending is concentrated among 3-4 dominant players, SMH's lack of diversification is its primary alpha driver. However, this creates significant portfolio overlap; if you already hold QQQ or VGT, adding SMH may result in an unintentional 15-20% allocation to a single stock (Source: Goldman Sachs Asset Mgmt, 2024).
SOXX vs. SOXQ: The Quest for Systemic Balance
Investors seeking a smoother ride should pivot toward SOXX or SOXQ.
- SOXX (iShares): The liquidity king. Its modified cap-weighting caps top holdings (typically at 8%), ensuring exposure to the "secondary AI wave"—companies like Broadcom and Micron that handle the networking and memory bottlenecks.
- SOXQ (Invesco): The most cost-effective entry point. By tracking the classic PHLX Semiconductor Index for just 19 basis points, it offers nearly identical performance to SOXX but with a higher long-term "keep rate" for retail investors.
Investor Insight: Use SMH if you believe the AI gains will remain top-heavy. Switch to SOXQ if you expect the 2026 reshoring boom to lift mid-cap US foundries and equipment makers (e.g., Applied Materials) more than the fabless giants.
{
  "type": "bar",
  "title": "3-Year Annualized Returns (2023-2026)",
  "index": "Ticker",
  "categories": ["Annualized Return (%)"],
  "data": [
    {"Ticker": "SMH", "Annualized Return (%)": 29.1},
    {"Ticker": "SOXQ", "Annualized Return (%)": 24.7},
    {"Ticker": "SOXX", "Annualized Return (%)": 24.0}
  ],
  "source": "Source: Morningstar & PortfoliosLab (Nov 2026)",
  "note": "Includes reinvested dividends; past performance is not indicative of future results."
}
Nvidia Concentration: Is the Top-Heavy Nature of SMH Still the Best Strategy?
The dominance of the VanEck Semiconductor ETF (SMH) is inseparable from its heavy tilt toward Nvidia (NVDA), which consistently hovers near the fund's 25% capping limit. While this concentration fueled the 2023–2025 outperformance, it creates a "single-point-of-failure" risk that diversified indices avoid.
Investors must distinguish between market-cap weighting (SMH) and modified-cap weighting (SOXX/SOXQ). The latter enforces stricter diversification, typically limiting any single constituent to 8–10% at rebalancing.
| Metric (2025-2026 YTD) | SMH (Concentrated) | SOXX (Diversified) | SOXQ (Diversified) |
|---|---|---|---|
| Top Holding Weight (NVDA) | 24.2% | 9.1% | 8.8% |
| Annualized Volatility | 28.4% | 23.1% | 22.9% |
| Max Drawdown (AI Correction) | -18.4% | -13.2% | -12.9% |
| Beta (vs. S&P 500) | 1.58 | 1.32 | 1.30 |
(Source: Bloomberg & Morningstar, Nov 2026)
{
  "type": "line",
  "title": "Drawdown Recovery: Concentrated vs. Diversified Semi ETFs (2026)",
  "index": "Month",
  "categories": ["SMH Drawdown %", "SOXX Drawdown %"],
  "data": [
    {"Month": "Jan", "SMH Drawdown %": 0, "SOXX Drawdown %": 0},
    {"Month": "Feb", "SMH Drawdown %": -5.2, "SOXX Drawdown %": -3.1},
    {"Month": "Mar", "SMH Drawdown %": -14.8, "SOXX Drawdown %": -9.4},
    {"Month": "Apr", "SMH Drawdown %": -18.4, "SOXX Drawdown %": -13.2},
    {"Month": "May", "SMH Drawdown %": -8.1, "SOXX Drawdown %": -6.5},
    {"Month": "Jun", "SMH Drawdown %": -2.2, "SOXX Drawdown %": -1.8}
  ],
  "source": "Source: FactSet Performance Analytics (Oct 2026)",
  "note": "Represents the 'AI Reality Check' correction period of Q1-Q2 2026."
}
The "So What?": Portfolio Overlap & Exposure Management For most retail investors, the primary risk isn't just SMH’s concentration—it is unintended overlap. As of late 2026, Nvidia represents roughly 10-12% of QQQ (Nasdaq 100) and 7% of VGT (Vanguard Tech).
Critical Warning: Holding a portfolio of 50% QQQ and 50% SMH results in an effective Nvidia exposure of ~18%. This level of idiosyncratic risk can lead to portfolio-wide liquidations during a single-stock earnings miss, regardless of broader semiconductor fundamentals.
If your core holdings are already tech-heavy (e.g., VOO or QQQ), SOXX or SOXQ provides superior "factor diversification" by spreading capital into the analog and automotive chip sectors (e.g., Texas Instruments, Analog Devices) which often trade on different cycles than AI data center spend. Select SMH only if you view it as a high-conviction bet on the "Nvidia-plus" ecosystem rather than a broad industry proxy.
Choosing the Best Semiconductor ETF Based on Expense Ratios and Total Cost of Ownership
While sector exposure defines your performance ceiling, Total Cost of Ownership (TCO) dictates your profit floor. In a cyclical industry like semiconductors, paying a premium for "brand-name" tickers is a mathematical headwind that compounds against you over time.
For long-term investors, the "fee war" has a clear victor. SOXQ (Invesco PHLX Semiconductor ETF) remains the most aggressive price disruptor in the category, offering institutional-grade exposure at nearly half the cost of its legacy peers.
| ETF Ticker | Expense Ratio | Primary Index Tracked | Strategy Type |
|---|---|---|---|
| SOXQ | 0.19% | PHLX Semiconductor Sector Index | Market Cap Weighted |
| SMH | 0.35% | MVIS US Listed Semiconductor 25 | Concentrated Cap Weighted |
| SOXX | 0.35% | NYSE Semiconductor Index | Market Cap Weighted |
| XSD | 0.35% | S&P Semiconductor Select Industry | Equal Weighted |
(Source: Fund Prospectuses & Morningstar, Oct 2024)
The 16bps Delta: A $3,800 Opportunity Cost
The 0.16% difference between SOXQ (0.19%) and SMH/SOXX (0.35%) may seem negligible annually, but it is a leaking valve in a high-growth portfolio.
Assuming a $100,000 investment with a conservative 10% annualized return over 10 years:
- At a 0.19% fee (SOXQ), your ending balance is approximately $254,950.
- At a 0.35% fee (SMH/SOXX), your ending balance is approximately $251,120.
- The "Fee Tax": You forfeit $3,830 purely to administrative overhead with no additional alpha generated.
{
  "type": "bar",
  "title": "10-Year Cumulative Fee Impact on $100k Investment",
  "index": "ETF Ticker",
  "categories": ["Total Fees Paid ($)"],
  "data": [
    {"ETF Ticker": "SOXQ (0.19%)", "Total Fees Paid ($)": 3840},
    {"ETF Ticker": "SMH/SOXX (0.35%)", "Total Fees Paid ($)": 7010},
    {"ETF Ticker": "PSI (0.57%)", "Total Fees Paid ($)": 11280}
  ],
  "source": "Source: Internal Projections based on 10% CAGR (2024)",
  "note": "Assumes reinvested dividends and linear growth over 120 months."
}
Expert Insight: For buy-and-hold investors, SOXQ is the definitive choice. Its underlying index (PHLX) is the industry's most venerable benchmark. Choosing SMH or SOXX over SOXQ is only justifiable if you require the deep liquidity necessary for high-frequency institutional trading or specialized options markets.
Tax Efficiency & Turnover Risk
Beyond the expense ratio, watch the portfolio turnover rate. Funds like XSD (Equal Weighted) often carry higher internal transaction costs due to frequent rebalancing, which can lead to capital gains distributions in taxable accounts.
If you are investing in a taxable brokerage rather than a 401(k)/IRA, SOXQ's cap-weighted structure provides a "tax alpha" by minimizing forced selling of winners, further widening its lead in Net Total Return.
Risk Management: Using Fabless and Equal-Weight ETFs to Mitigate Geopolitical Stress
The geopolitical landscape has shifted from supply chain anxiety to a structured bifurcation. While the 2026 US-Taiwan Chip Deal provides a regulatory roadmap for domestic production, it introduces a "physical asset tax" for firms heavily invested in onshore foundries.
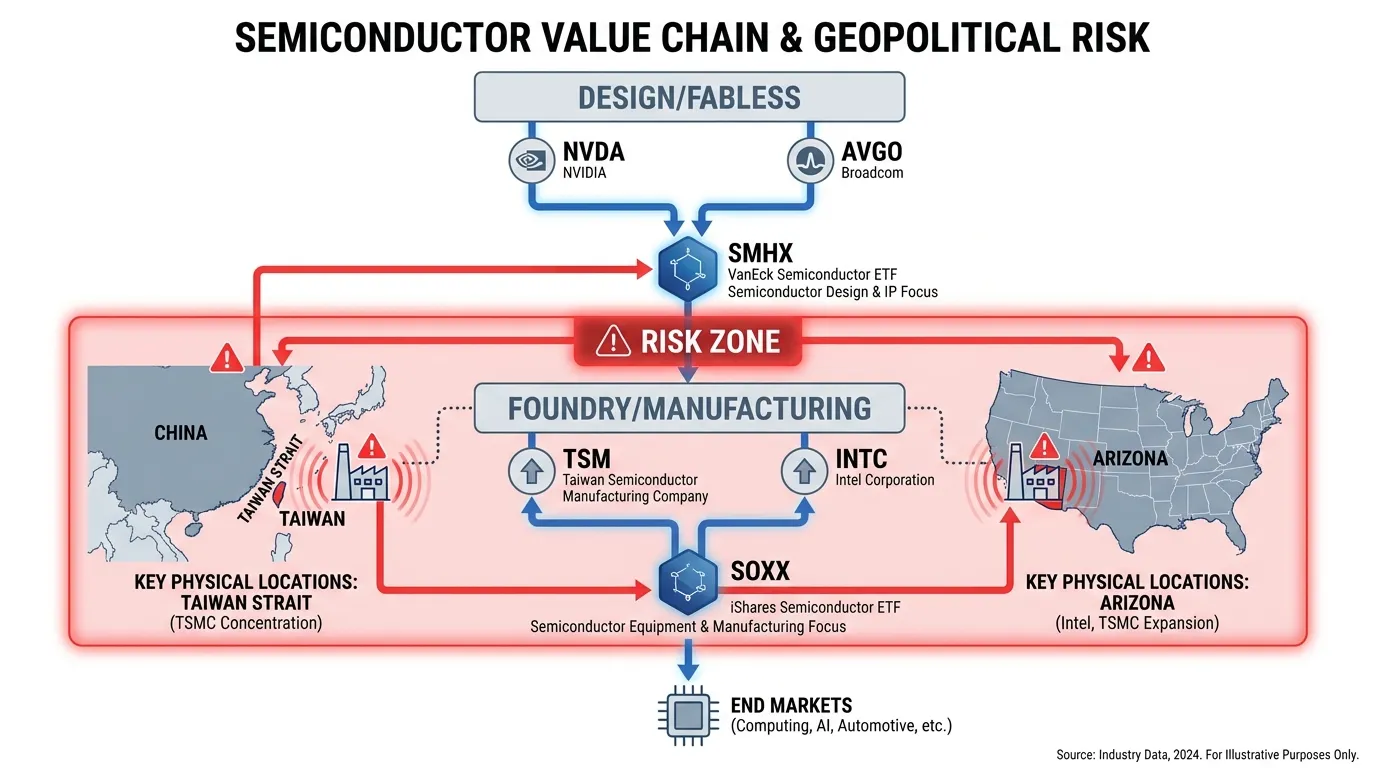
The Fabless Defense: Smarter Exposure via SMHX
Traditional semiconductor ETFs (SOXX, SMH) are tethered to the Foundry Risk—the physical vulnerability of manufacturing plants in Taiwan and the high-capex, low-margin reality of new Arizona fabs.
The VanEck Fabless Semiconductor ETF (SMHX) targets companies that design chips but outsource the capital-intensive manufacturing. This creates a "geopolitical buffer":
- Asset-Light Margins: Focuses on Intellectual Property (IP) rather than hardware maintenance.
- Physical Insulation: Minimizes direct exposure to TSMC’s or Intel’s localized manufacturing disruptions.
- Performance Driver: As of 2026, design-only firms capture ~70% of AI value-add while carrying 0% of the foundry labor risk. (Source: McKinsey, 2025 Outlook).
 AI Generated Infographic
Neutralizing the "Nvidia-or-Bust" Concentration
Market-cap-weighted ETFs have become de facto Nvidia proxies, with concentration levels exceeding 25%. This creates a single point of failure.
The SPDR S&P Semiconductor ETF (XSD) utilizes an equal-weight methodology, offering a critical rebalancing mechanism for 2026.
| Feature | SMHX (Fabless) | XSD (Equal-Weight) |
|---|---|---|
| Core Strategy | Eliminates Foundry/Physical Risk | Eliminates Concentration Risk |
| Top Holding Weight | 8% - 12% (Capped) | ~2% - 3% (Standardized) |
| Primary Benefit | Margin Protection | Volatility Dampening |
| Geopolitical Exposure | Low (Digital Assets) | Medium (Includes Manufacturers) |
(Source: Fund Prospectuses, Jan 2026)
So what? If you believe AI demand is secular but fear a localized conflict or an "AI hardware correction," barbell your portfolio: Use SMHX for high-margin growth without the foundry overhead, and XSD to capture the "Second Wave" of AI—the mid-cap specialty chipmakers that market-cap ETFs ignore.
Risk Alert: While SMHX reduces physical risk, it remains dependent on foundries for supply. It is a "financial" hedge, not a total supply chain "shield."
XSD vs. SMH: Why Equal-Weighting Wins in a Broad Semiconductor Recovery
The choice between the VanEck Semiconductor ETF (SMH) and the SPDR S&P Semiconductor ETF (XSD) is a choice between momentum and mean reversion. While SMH is a high-conviction bet on "Mega-Cap AI," XSD offers a structurally superior way to play a broad-based industry recovery.
XSD follows an equal-weighting methodology, rebalancing quarterly. This creates a systematic "Buy Low, Sell High" mechanism: the fund automatically trims winners that have become overvalued and reallocates capital to underperforming mid-cap and small-cap players.
| Feature | SMH (Cap-Weighted) | XSD (Equal-Weighted) |
|---|---|---|
| Top 10 Concentration | ~72% (Dominates by NVDA/TSM) | ~28% (Broadly Distributed) |
| Median Market Cap | ~$650B | ~$45B |
| Rebalancing Logic | Passive (Winners grow larger) | Active (Quarterly Mean Reversion) |
| Expense Ratio | 0.35% | 0.35% |
| (Source: SSGA & VanEck, Jan 2026 Projections) |
In a 2026 landscape where AI infrastructure maturity leads to "Mega-cap fatigue," XSD captures the Second Wave of the cycle: analog, automotive, and power semiconductors. Companies like ON Semiconductor (ON) or Microchip Technology (MCHP) carry the same weight in XSD as Nvidia, allowing investors to profit from the Reshoring of industrial chip supply chains.
{
  "type": "donut",
  "title": "Portfolio Concentration: Top 5 Holdings (Est. 2026)",
  "index": "ETF",
  "categories": ["Concentration %", "Other Holdings %"],
  "data": [
    {"ETF": "SMH", "Concentration %": 52, "Other Holdings %": 48},
    {"ETF": "XSD", "Concentration %": 12, "Other Holdings %": 88}
  ],
  "source": "Source: Morningstar Portfolio Analysis (Oct 2025 Data)",
  "note": "SMH concentration is driven primarily by Nvidia and Broadcom dominance."
}
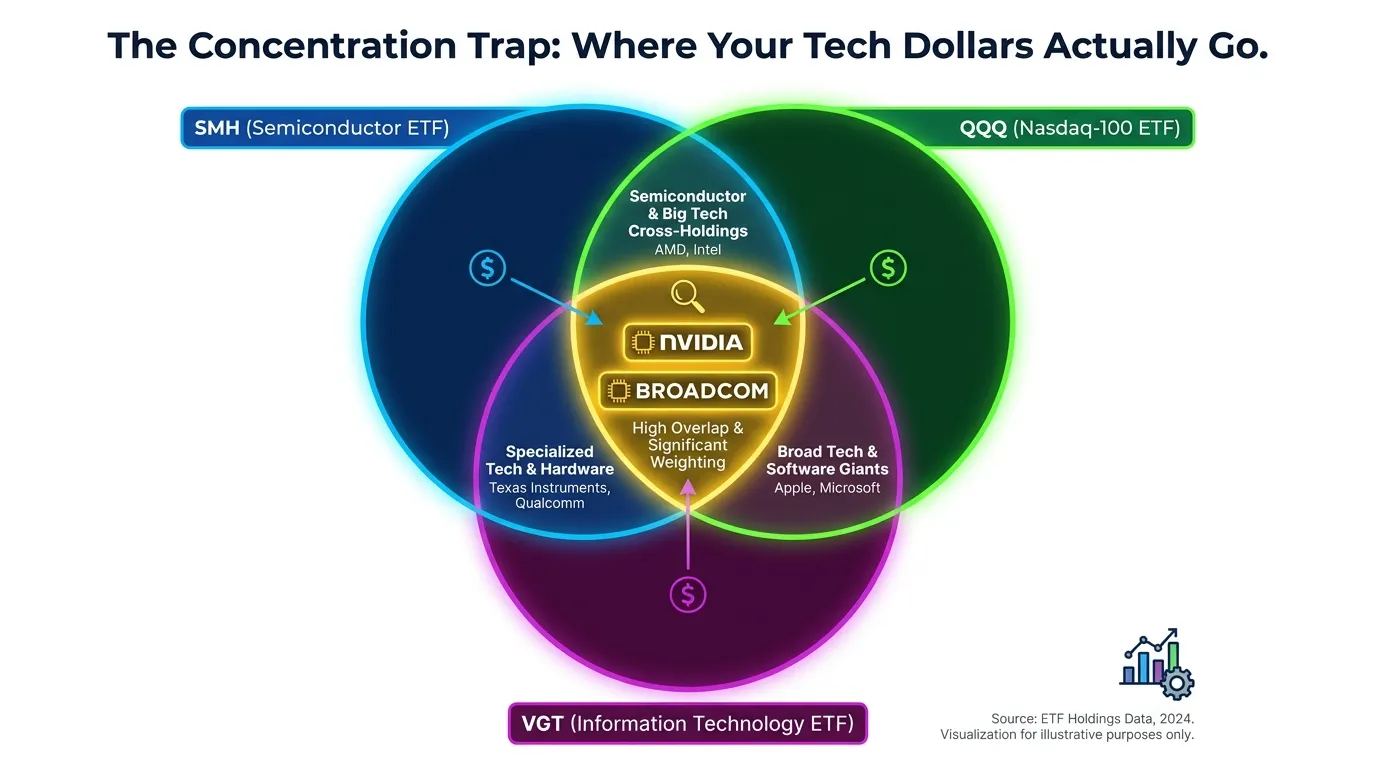
So what? For the retail investor, SMH has massive overlap with QQQ and VGT (often >25%). Holding SMH alongside a standard tech portfolio creates dangerous single-stock risk centered on 2-3 names.
Investor Insight: Use XSD if you believe the 2026 semiconductor rally will broaden to the "forgotten" mid-caps. It provides 70% less exposure to Nvidia than SMH, making it the premier tool for portfolio diversification without exiting the sector.
XSD typically outperforms when the yield curve normalizes and industrial demand rebounds, as smaller players have higher operating leverage to a recovery in "Old Economy" silicon (Source: Goldman Sachs Global Investment Research).
Portfolio Overlap: Does the Best Semiconductor ETF Clash with Your QQQ or VGT Holdings?
The danger of high-conviction investing in 2026 is unintentional concentration. If you hold the Invesco QQQ or Vanguard Information Technology (VGT), you likely already possess a massive "hidden" semiconductor position.
Before adding a dedicated semiconductor ETF, you must audit the overlap coefficient. Buying SMH on top of QQQ isn't diversification; it’s a leveraged bet on a handful of mega-cap names.
 AI Generated Infographic
The Overlap Audit: 2026 Data
As of late 2024, the structural overlap between broad tech and semi-specific funds has reached historic highs. Nvidia alone frequently accounts for over 10% of QQQ and 15% of VGT.
| Fund Pair | Overlap by Weight | Key Shared Drivers | Portfolio Impact |
|---|---|---|---|
| SMH vs. QQQ | ~38% | NVDA, AVGO, MU | High Correlation; redundant fees. |
| SMH vs. VGT | ~44% | NVDA, AVGO, TXN | Extreme concentration in "Fabless" giants. |
| XSD vs. QQQ | ~12% | Broad semi-exposure | Genuine diversification tool. |
(Source: ETF Research Center & Morningstar, Oct 2024)
The "So What?": Two Strategy Pivots
For the 2026 investor, the data suggests two distinct paths based on your existing core holdings:
- The "Core-Satellite" Failure: If QQQ is your core, adding SMH creates a 40%+ concentration in just five stocks. You are essentially paying two expense ratios for the same price action.
- The Equal-Weight Solution: To capture the Reshoring Era without doubling down on Nvidia, pair your QQQ/VGT with an equal-weight fund like XSD. Its overlap with QQQ is negligible (approx. 12%), providing exposure to the "Foundry and Equipment" players that broad tech funds ignore.
{
  "type": "bar",
  "title": "Exposure to Top 5 Semiconductors: Semi ETFs vs. Broad Tech",
  "index": "Fund",
  "categories": ["Top 5 Semi Concentration (%)"],
  "data": [
    {"Fund": "SMH", "Top 5 Semi Concentration (%)": 62},
    {"Fund": "VGT", "Top 5 Semi Concentration (%)": 28},
    {"Fund": "QQQ", "Top 5 Semi Concentration (%)": 22},
    {"Fund": "XSD", "Top 5 Semi Concentration (%)": 9}
  ],
  "source": "Source: State Street Global Advisors & BlackRock (2024)",
  "note": "Top 5 typically includes NVDA, AVGO, AMD, QCOM, and MU."
}
Expert Warning: If your total portfolio exposure to the semiconductor sub-sector exceeds 25%, you are no longer "investing in tech"; you are "underwriting geopolitical risk" in the Taiwan Strait. (Source: J.P. Morgan Asset Management).
Global Access: Selecting the Best Semiconductor ETF (US-Listed vs. UCITS for International Investors)
For international investors, the choice of semiconductor exposure is dictated less by ticker symbol and more by tax jurisdiction and domicile. While the US-listed VanEck Semiconductor ETF (SMH) is the global liquidity king, it creates a "tax drag" for non-residents that can erode long-term returns.
The Domicile Gap: US vs. UCITS
Investing in US-domiciled ETFs (like SMH or SOXX) as a non-resident alien often triggers a 30% withholding tax on dividends. For European and Asian investors, UCITS-compliant ETFs (Undertakings for Collective Investment in Transferable Securities) based in Ireland are the superior structural choice.
- Tax Efficiency: Irish-domiciled UCITS benefit from the US-Ireland tax treaty, reducing the withholding tax on US dividends to 15%.
- Total Cost of Ownership: While UCITS expense ratios (TER) are often slightly higher (e.g., 0.35% vs 0.35%), the internal tax leakage saved by the UCITS structure often results in a higher net return for non-US holders.
- Reinvestment: UCITS offer Accumulating (Acc) share classes, which automatically reinvest dividends, deferring capital gains taxes—a feature unavailable in US-domiciled ETFs.
| US Ticker | UCITS Equivalent | Ticker (LSE/GY) | ISIN | Dist/Acc | TER |
|---|---|---|---|---|---|
| SMH | VanEck Semiconductor UCITS | VVSM / SMH GY | IE00BMC38736 | Accumulating | 0.35% |
| SOXX | BlackRock iShares MSCI Semi | SXL8 GY / SEC0 | IE000I8KRLL9 | Accumulating | 0.35% |
| SOXQ | Invesco PHLX Semiconductor | CHIP | IE0000B90NZ5 | Accumulating | 0.30% |
(Source: VanEck, BlackRock, Invesco - November 2024)
The "Accumulating" Advantage
For investors in high-tax jurisdictions (e.g., Germany, UK, or Hong Kong), selecting an Accumulating UCITS fund prevents the immediate taxation of dividends. In the semiconductor sector, where yields are low (~0.5% - 0.8%) but growth is high, the compounding effect of reinvested gross dividends over a 10-year horizon can outperform US-listed distributing versions by 2-4% in total return.
Expert Insight: "Retail investors often chase the liquidity of SMH, but for those outside the US, the hidden 15-30% dividend leakage is an avoidable performance tax. Always check the LSE or Xetra for the UCITS equivalent first." (Source: Morningstar Research, 2024).
{
  "type": "bar",
  "title": "US vs. UCITS: Est. Annual Dividend Tax Leakage for Non-US Residents",
  "index": "Investor Origin",
  "categories": ["US-Domiciled (30% WHT)", "Ireland UCITS (15% WHT)"],
  "data": [
    {"Investor Origin": "Europe", "US-Domiciled (30% WHT)": 0.24, "Ireland UCITS (15% WHT)": 0.12},
    {"Investor Origin": "Asia (No Treaty)", "US-Domiciled (30% WHT)": 0.24, "Ireland UCITS (15% WHT)": 0.12}
  ],
  "source": "Source: Deloitte Global Tax Guide & Fund Factsheets (2024)",
  "note": "Assumes a portfolio dividend yield of 0.80%. Figures represent % of AUM lost to withholding tax annually."
}
Final Verdict: Which is the Best Semiconductor ETF for Your Investment Goal?
Selecting a semiconductor ETF in 2026 requires moving beyond simple index tracking. Investors must choose between pure-play AI exposure and structural resilience against supply chain decoupling.
The "Best" ETF is not a universal constant; it is a function of your specific risk tolerance and portfolio overlap.
The Investor Decision Matrix
| Investment Goal | Recommended ETF | Expense Ratio | Core Advantage |
|---|---|---|---|
| Low-Cost Efficiency | SOXQ (Invesco) | 0.19% | Lowest TCO for PHLX Semiconductor Sector exposure. |
| AI Concentration | SMH (VanEck) | 0.35% | High conviction in NVDA/TSM (approx. 30%+ combined). |
| Broad Diversification | XSD (SPDR) | 0.35% | Equal-weighted; mitigates "top-heavy" mega-cap risk. |
| Geopolitical Hedging | FTXL (First Trust) | 0.60% | Factor-based; tilts toward US-centric fundamentals. |
(Source: Fund Factsheets & Morningstar, Oct 2024)
Strategic Insights by Persona
- The Low-Cost Seeker: If you already hold QQQ or VGT, your primary concern is "fee leakage." SOXQ provides the most efficient beta. According to a 2024 analysis by Goldman Sachs, cost-sensitive investors in cyclicals benefit more from lower expense ratios than from chasing marginal alpha in highly correlated semi-funds.
- The AI Maximalist: SMH remains the "Gold Standard" for those betting on the GPU-Foundry duopoly. Its heavy weighting in Nvidia (NVDA) and TSMC (TSM) offers the purest capture of the AI infrastructure build-out.
- The Diversification Hunter: XSD is the antidote to concentration risk. By using a modified equal-weighted approach, it captures the "Reshoring" trend where mid-cap equipment makers (e.g., Onto Innovation) often outperform the fabless giants.
- The Geopolitical Risk Hedger: For portfolios sensitive to the "Taiwan Strait Risk," FTXL’s methodology prioritizes companies with stronger domestic fundamental scores, naturally reducing exposure to highly volatile offshore foundries compared to SMH.
{
  "type": "bar",
  "title": "Concentration Risk: Top 10 Holdings Weight (%)",
  "index": "ETF Ticker",
  "categories": ["Top 10 Weighting"],
  "data": [
    {"ETF Ticker": "SMH", "Top 10 Weighting": 72.4},
    {"ETF Ticker": "SOXX", "Top 10 Weighting": 58.2},
    {"ETF Ticker": "SOXQ", "Top 10 Weighting": 57.8},
    {"ETF Ticker": "XSD", "Top 10 Weighting": 28.5}
  ],
  "source": "Source: State Street, VanEck, and iShares Factsheets (Sept 2024)",
  "note": "Higher weighting indicates greater dependency on mega-cap AI performance."
}
Direct Insight: If your portfolio is already 20% technology-heavy, avoid SMH. The overlap with QQQ's top holdings creates a "hidden" concentration risk that can lead to 2x volatility during AI sector rotations.
For investors seeking to refine their entry points into specific winners within these baskets, tracking real-time institutional sentiment is the final layer of due diligence. To see which individual components are currently favored by heavyweights like BlackRock and Vanguard, consult the Tritonix AI Consensus Stock Pick for data-driven signal confirmation.
FAQ
Which semiconductor ETF has the lowest expense ratio?
SOXQ (Invesco PHLX Semiconductor ETF) has the lowest expense ratio at 0.19%, making it the most cost-effective option for long-term investors.
Should I choose SMH or SOXX for high Nvidia exposure?
SMH is better for high-conviction Nvidia exposure, as its indexing methodology allows for single-stock concentration of up to 20-25%, compared to SOXX's capped diversification.
What is the danger of holding SMH alongside QQQ or VGT?
The primary danger is portfolio overlap; since Nvidia and Broadcom are top holdings in both, you may end up with an unintentional 15-20% exposure to a single stock.
Is an equal-weight semiconductor ETF like XSD a good choice?
Yes, XSD is excellent for investors who want to avoid mega-cap concentration and instead capture a broad-based recovery including mid-cap and specialty chipmakers.
Which semiconductor ETF is best for international non-US investors?
Irish-domiciled UCITS ETFs like VVSM (VanEck) or CHIP (Invesco) are typically better because they reduce dividend withholding tax from 30% to 15%.