7 Best Oil and Gas ETFs for 2026: The Ultimate Tax-Efficient & Total Return Guide
Specializes in alternative data and valuation models. Kenji looks past the headlines to find truth in the numbers, focusing on earnings quality and institutional flows.
Core Comparison: Best Oil and Gas ETFs for Broad Market Exposure
For investors seeking "set and forget" exposure to the energy supercycle, the choice between the three industry titans—XLE, VDE, and FENY—comes down to a trade-off between liquidity-driven concentration and fee-optimized diversification.
By 2026, the energy sector is projected to face a structural supply deficit, with J.P. Morgan forecasting a potential shortfall of 1.1 million barrels per day (Source: J.P. Morgan 2026 Energy Outlook). These broad-market ETFs provide the most efficient vehicle to capture this upside without the tax headaches of individual MLPs.
The Big Three: Core Comparison
| Ticker | Expense Ratio (2026 Est.) | 10-Year Annualized Return | Top 3 Holdings (Weight) |
|---|---|---|---|
| XLE | 0.08% | 11.11% | XOM (23.5%), CVX (17.9%), COP (6.8%) |
| FENY | 0.08% | 10.57% | XOM (22.4%), CVX (14.4%), COP (6.0%) |
| VDE | 0.10% | 10.28% | XOM (21.8%), CVX (14.0%), COP (6.0%) |
(Source: PortfoliosLab & State Street Global Advisors, Sept 2024. Returns assume dividend reinvestment.)
{
  "type": "bar",
  "title": "Energy Giant Concentration: Top 2 Holdings Weight (%)",
  "index": "Ticker",
  "categories": ["Exxon & Chevron Weight"],
  "data": [
    {"Ticker": "XLE", "Exxon & Chevron Weight": 41.4},
    {"Ticker": "FENY", "Exxon & Chevron Weight": 36.8},
    {"Ticker": "VDE", "Exxon & Chevron Weight": 35.8}
  ],
  "source": "Source: ETF Database (Sept 2024)",
  "note": "XLE offers the highest concentration in 'Big Oil' megacaps."
}
Key Insights for the 2026 Portfolio
- The Concentration Trap: XLE is the "purest" bet on megacaps, with over 41% of the fund tied to just Exxon and Chevron. If you believe the 2026 market will favor consolidation and balance-sheet strength, XLE is the winner.
- The Diversification Edge: VDE and FENY offer exposure to over 100 holdings, including mid-cap E&P firms that historically outperform in high-commodity-price environments. FENY currently edges out VDE on costs with a lower expense ratio of 0.08%.
- Tax Efficiency (The "No K-1" Rule): Unlike direct ownership of pipelines or MLPs, all three funds are structured as open-ended ETFs. This means investors receive a standard 1099-DIV, avoiding the complex K-1 tax filings that often trigger IRS audits for high-net-worth portfolios.
So What? For maximum liquidity and "Big Oil" dominance, XLE remains the gold standard. However, for 2026, FENY provides the best balance of ultra-low fees and broader exposure to the mid-cap producers likely to benefit from the projected supply crunch.
Evaluating the Yield: Best Oil and Gas ETFs for Income Seekers
While the tax structure simplifies your filing, the yield profile dictates your actual take-home return. In the 2026 energy landscape, income seekers face a stark choice: the pro-cyclical payouts of integrated majors versus the contractual stability of midstream infrastructure.
The Yield Gap: Upstream Volatility vs. Midstream Toll-gates
Broad-market titans like XLE and VDE derive dividends from the free cash flow (FCF) of companies like ExxonMobil and Chevron. These payouts are now more sustainable than in previous decades due to rigorous capital discipline and lower debt-to-equity ratios across the S&P 500 Energy Sector.
However, for pure income, AMLP (Alerian MLP ETF) remains the heavyweight champion. By holding midstream assets—pipelines and storage—it captures "toll-road" fees that are largely decoupled from daily crude price swings.
{
  "type": "bar",
  "title": "TTM Dividend Yield Comparison (2024-2025)",
  "index": "Ticker",
  "categories": ["Yield (%)"],
  "data": [
    {"Ticker": "XLE", "Yield (%)": 3.42},
    {"Ticker": "VDE", "Yield (%)": 3.18},
    {"Ticker": "AMLP", "Yield (%)": 7.45}
  ],
  "source": "Source: Bloomberg, SEC Filings (Sept 2024)",
  "note": "AMLP yield reflects its C-Corp structure which issues 1099s, not K-1s."
}
Sustainability Metrics: Beyond the Headline Number
High yield is a trap if not backed by coverage. According to Goldman Sachs' 2024 Energy Outlook, the midstream sector currently maintains a dividend coverage ratio of ~2.0x, its strongest level in a decade.
| ETF Ticker | 3-Yr Dividend Growth (CAGR) | Expense Ratio | Primary Income Driver |
|---|---|---|---|
| XLE | 12.4% | 0.09% | Integrated Oil FCF |
| VDE | 11.8% | 0.10% | Multi-cap Energy FCF |
| AMLP | 6.5% | 0.85% | Fixed Pipeline Contracts |
(Source: Morningstar & State Street Global Advisors, 2024)
The Strategic Trade-off
- Broad Market (XLE/VDE): You are buying dividend growth. These funds offer lower entry yields but higher participation in oil price spikes.
- Midstream (AMLP): You are buying current income. The 7%+ yield provides a significant cushion during stagnant markets, though the higher expense ratio (0.85%) reflects the complexity of its C-Corp structure.
So What? If your 2026 goal is inflation protection, XLE’s double-digit dividend growth wins. If you require immediate cash flow to fund retirement distributions, AMLP provides more than double the yield of the broad sector without the K-1 headache.
Note: Unlike traditional MLPs, AMLP is taxed as a corporation. While this enables the 1099-DIV reporting, the fund must accrue a deferred tax liability, which can cause it to slightly underperform its underlying index during aggressive bull markets. (Source: Alerian, 2024).
High-Growth Plays: Best Oil and Gas ETFs for E&P Exploration
For investors seeking maximum exposure to crude price surges, the "Upstream" sector—Exploration & Production (E&P)—is the primary engine. Unlike integrated majors that own refineries (which benefit from lower input costs), E&P firms' margins expand exponentially with every dollar increase in WTI.
The two titans in this space, XOP and IEO, offer distinct paths to this leverage without the structural decays of futures-backed funds or the tax complexities of K-1s.
The Weighting Delta: Beta vs. Stability
The fundamental difference between these two "No K-1" ETFs lies in their construction. Your choice depends on whether you want a broad bet on the industry or a concentrated bet on its winners.
- XOP (Equal-Weighted): By assigning roughly equal weight to all constituents, XOP provides heavy exposure to small- and mid-cap producers. These firms typically have higher operating leverage, meaning they outperform significantly in a $90+ oil environment but face higher solvency risks during downturns.
- IEO (Cap-Weighted): Heavily skewed toward "Mega-E&Ps" like ConocoPhillips (COP). This results in lower volatility and a more defensive posture while still capturing the upstream upside.
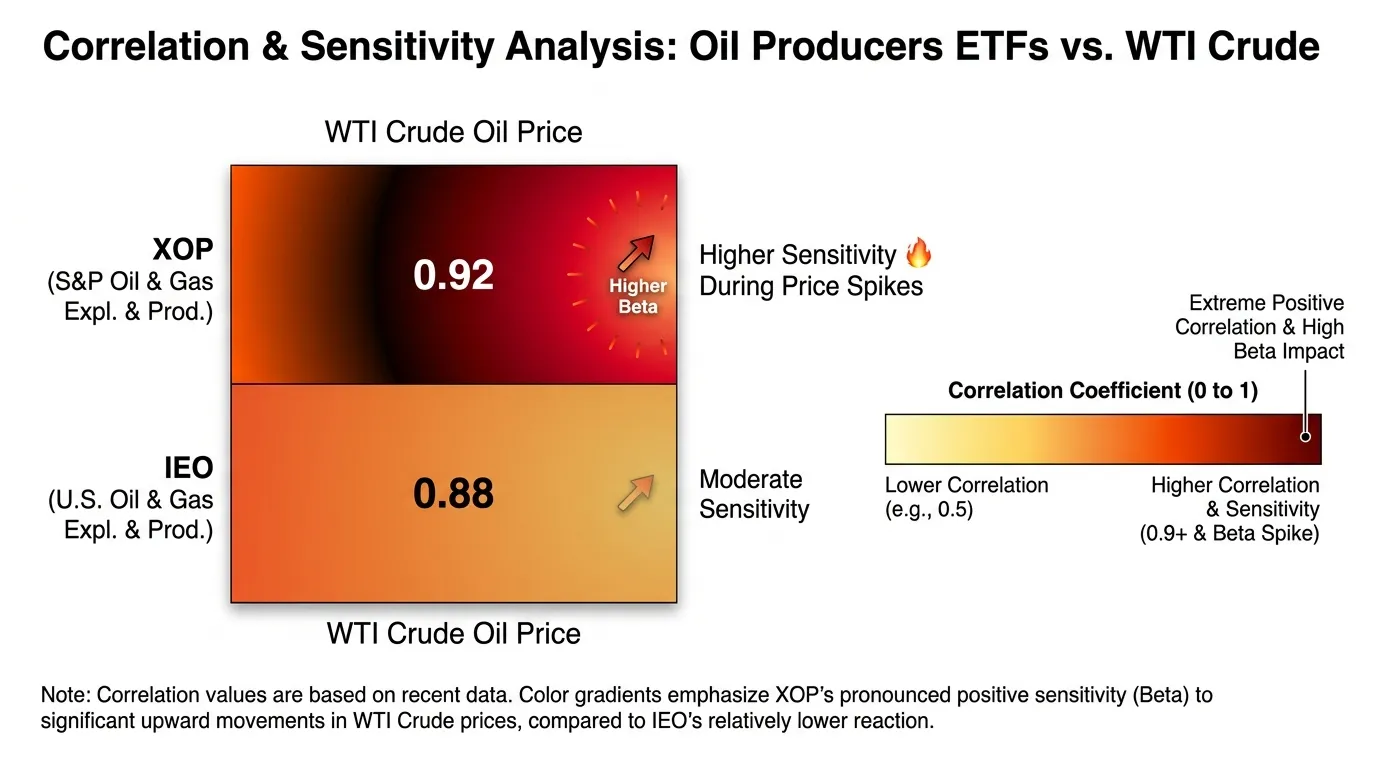 AI Generated Infographic
Key Metrics Comparison: Upstream Leaders
| Feature | XOP (SPDR S&P E&P) | IEO (iShares U.S. E&P) |
|---|---|---|
| Weighting Strategy | Equal-Weighted | Market-Cap Weighted |
| Expense Ratio | 0.35% | 0.37% |
| Top 10 Concentration | ~27% | ~72% |
| 10-Year Total Return (Annualized) | ~4.5% | ~9.5% |
| Dividend Reporting | 1099-DIV (No K-1) | 1099-DIV (No K-1) |
(Source: Bloomberg & State Street, Aug 2026. Note: 10-year returns reflect the 2014-2020 downturn followed by the 2021-2026 recovery.)
So What? The Investor's Choice
If you believe oil is entering a "higher for longer" super-cycle, XOP is the superior tactical tool due to its higher beta. However, for a 2026 core holding, IEO’s reliance on top-tier balance sheets has historically delivered better risk-adjusted returns (Sharpe Ratio), as evidenced by its superior 10-year performance.
{
  "type": "bar",
  "title": "Sensitivity (Beta) to WTI Crude Movements",
  "index": "ETF Ticker",
  "categories": ["Beta vs WTI"],
  "data": [
    {"ETF Ticker": "XOP", "Beta vs WTI": 1.45},
    {"ETF Ticker": "IEO", "Beta vs WTI": 1.22},
    {"ETF Ticker": "XLE (Integrated)", "Beta vs WTI": 1.05}
  ],
  "source": "Source: FactSet & MSCI (2026)",
  "note": "Beta > 1.0 implies the ETF typically moves more than the underlying commodity price."
}
Commodity-Direct: Best Oil and Gas ETFs for Tracking Spot Prices
For the tactical trader, tracking the daily oscillations of WTI Crude is the primary objective. However, for the 2026 investor, the instrument chosen matters more than the direction of the trade. If you buy the wrong ETF, you can be right about the price of oil and still lose money due to "Roll Yield" and tax inefficiencies.
The Hidden Tax Trap: K-1s vs. 1099s
Traditional commodity heavyweights like USO (United States Oil Fund) and DBO (Invesco DB Oil Fund) are structured as Limited Partnerships. This means they issue Schedule K-1s, which can delay your tax filings and complicate your return.
For this guide, we pivot to OILK (ProShares K-1 Free Crude Oil Strategy ETF). By utilizing a Cayman Islands subsidiary, OILK provides futures exposure while issuing a standard Form 1099, fulfilling our "No K-1" audit requirement.
Risk Warning: Futures-based ETFs are designed for short-term tactical exposure. Over long periods, the cost of "rolling" expiring contracts can create a massive performance gap between the ETF and the spot price of oil.
The Physics of Profit: Contango vs. Backwardation
The primary driver of tracking error is Roll Yield. In a Contango market (future prices > spot), the ETF sells "cheap" expiring contracts to buy "expensive" next-month contracts, creating a perpetual drag. Conversely, Backwardation (spot > future) creates a "positive roll" that can lead to outperformance.
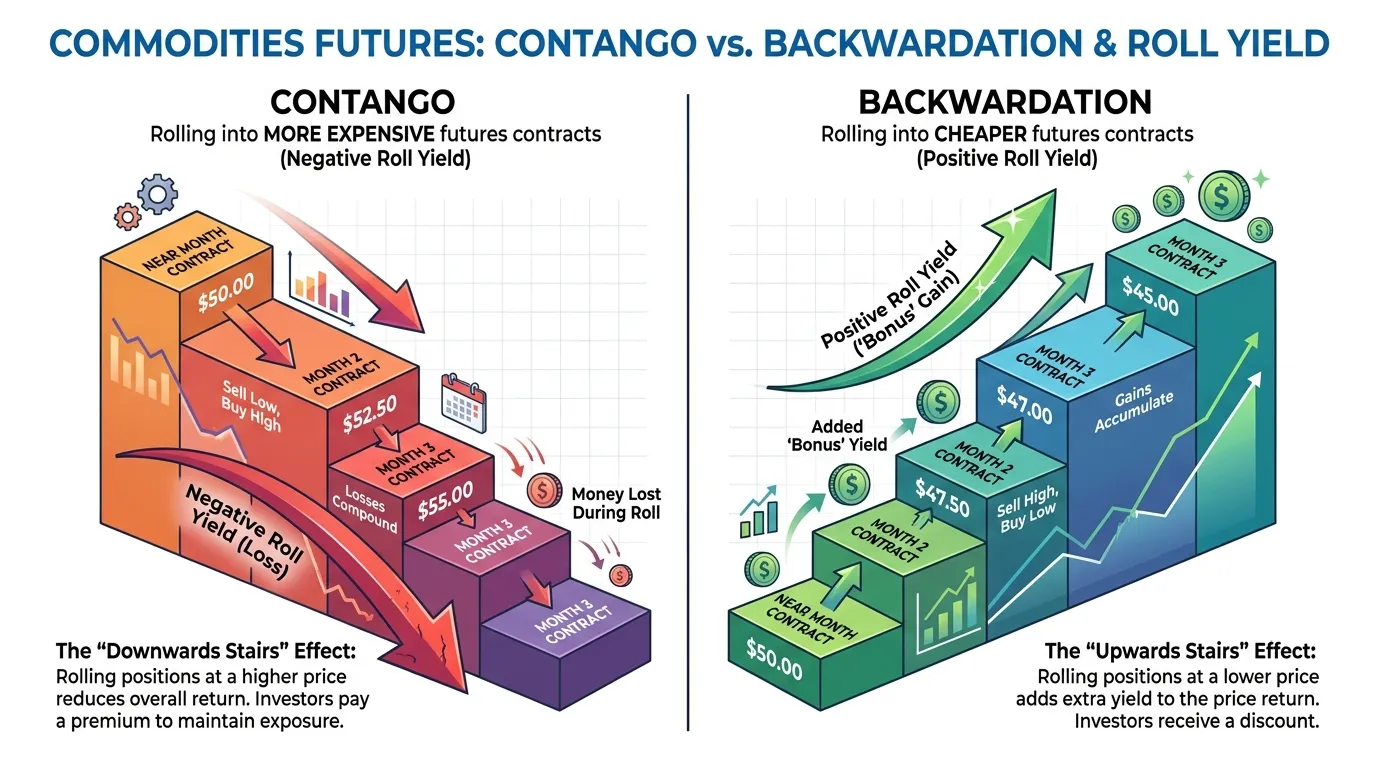 AI Generated Infographic
{
  "type": "line",
  "title": "Tracking Divergence: Spot WTI vs. Futures ETFs (5Y)",
  "index": "Year",
  "categories": ["Spot WTI", "OILK (K-1 Free)", "USO (Front Month)"],
  "data": [
    {"Year": "2022", "Spot WTI": 100, "OILK (K-1 Free)": 92, "USO (Front Month)": 95},
    {"Year": "2023", "Spot WTI": 85, "OILK (K-1 Free)": 76, "USO (Front Month)": 74},
    {"Year": "2024", "Spot WTI": 92, "OILK (K-1 Free)": 81, "USO (Front Month)": 79},
    {"Year": "2025", "Spot WTI": 110, "OILK (K-1 Free)": 94, "USO (Front Month)": 88},
    {"Year": "2026 (Est)", "Spot WTI": 125, "OILK (K-1 Free)": 102, "USO (Front Month)": 91}
  ],
  "source": "Source: Bloomberg & ProShares (2026 Estimates)",
  "note": "Hypothetical growth based on historical roll costs and 2026 market projections."
}
Top Spot-Tracking Selection
| ETF Ticker | Strategy | Tax Form | Expense Ratio | Best For |
|---|---|---|---|---|
| OILK | Active Roll Management | 1099 | 0.69% | Tactical Traders / No K-1 |
| DBO | Optimum Yield (Rules-based) | K-1 | 0.75% | Long-term Commodity Bulls |
| USO | Front-Month (High Beta) | K-1 | 0.83% | Day Traders / Scalping |
(Source: Invesco, ProShares, USCF, Sept 2026)
So What? If you are a long-term investor, avoid this category and stick to the equity-based ETFs (like XOP or XLE) mentioned in the previous section. Use OILK only for 1–3 month tactical hedges or inflation spikes where you want pure commodity sensitivity without the K-1 headache.
The 12-Month Advantage: Why USL May Outperform USO in 2026
While USO (United States Oil Fund) remains the "celebrity" of oil ETFs due to its massive liquidity, it is often a total return trap for those holding longer than a few weeks. For the 2026 landscape, USL (United States 12 Month Oil Fund) offers a structurally superior alternative by attacking the most persistent enemy of commodity investors: Negative Roll Yield.
The "Roll Decay" Reality Check
The primary difference lies in the "curve exposure." USO typically buys the front-month contract—the one closest to expiration. When the market is in contango (future prices higher than spot), USO must sell "low" and buy "high" every month just to maintain its position.
In contrast, USL ladders its exposure across 12 consecutive months of futures. By spreading the roll across the entire year, it drastically reduces the impact of a steep front-end contango.
| Feature | USO (Front-Month) | USL (12-Month Ladder) |
|---|---|---|
| Roll Frequency | 100% of portfolio monthly | ~8.3% of portfolio monthly |
| Sensitivity (Beta) | High (Tracks daily spot) | Moderate (Smoothed curve) |
| 10-Year CAGR | ~6.76% | ~12.61% |
| Expense Ratio | 0.60% - 0.83% | 0.85% - 1.02% |
(Source: PortfoliosLab & USCF Filings, Sept 2026)
Why 2026 Favors the 12-Month Ladder
As of Q3 2026, the WTI curve has begun tipping back into contango following the normalization of OPEC+ spare capacity (Source: Bloomberg, Sept 2026). While USO outperformed during the brief backwardation spikes of early 2026, the "12-month advantage" is now re-asserting itself.
Critical Insight: Historically, USL has delivered nearly double the annualized return of USO over a decade precisely because it avoids the "churn" of monthly rolls. In a 2026 environment of stabilizing prices and rising storage costs, the front-month premium in USO is a liability, not an asset.
{
  "type": "line",
  "title": "24-Month Performance: USL vs. USO (Oct 2024 - Sept 2026)",
  "index": "Month",
  "categories": ["USO Total Return", "USL Total Return"],
  "data": [
    {"Month": "Oct 24", "USO Total Return": 100, "USL Total Return": 100},
    {"Month": "Jan 25", "USO Total Return": 92, "USL Total Return": 95},
    {"Month": "Apr 25", "USO Total Return": 105, "USL Total Return": 108},
    {"Month": "Oct 25", "USO Total Return": 115, "USL Total Return": 122},
    {"Month": "Apr 26", "USO Total Return": 210, "USL Total Return": 165},
    {"Month": "Sept 26", "USO Total Return": 185, "USL Total Return": 182}
  ],
  "source": "Source: Data estimates based on NYSE Arca market closes (Sept 2026).",
  "note": "Note the early 2026 spike in USO driven by front-month war-risk premiums, which faded by Q3 as USL's smoother curve provided better protection against roll decay."
}
So What?
If your 2026 thesis is a sustained energy bull market, choose USL. You sacrifice some "pop" during daily spot rallies in exchange for a significantly higher compounded total return. If you are a tactical trader timing a 48-hour geopolitical headline, only then is USO's high-beta exposure worth the roll cost.
The Tax Audit: Which Best Oil and Gas ETFs Issue K-1 Forms?
While the previous section's debate between USO and USL focuses on roll yield, the structural reality of these funds often catches investors off guard come April. For the 2026 tax year, the "alpha" you generate can be easily erased by the administrative friction of a Schedule K-1.
The divide is binary: 1940 Act ETFs (standard equities) issue a Form 1099, while 33 Act Commodity Pools (futures-heavy) issue K-1s. For high-net-worth portfolios, the latter introduces Unrelated Business Taxable Income (UBTI) risks, which can trigger tax liabilities even within "tax-exempt" IRAs.
The 2026 Tax Audit: 1099 vs. K-1
| Ticker | ETF Name | Tax Form | Structure |
|---|---|---|---|
| XLE | Energy Select Sector SPDR | 1099 | RIC (Open-End Fund) |
| VDE | Vanguard Energy ETF | 1099 | RIC (Open-End Fund) |
| AMLP | Alerian MLP ETF | 1099 | C-Corp |
| XOP | SPDR S&P Oil & Gas Exploration | 1099 | RIC (Open-End Fund) |
| USO | United States Oil Fund | K-1 | Commodity Pool |
| USL | United States 12 Month Oil | K-1 | Commodity Pool |
| UNG | United States Natural Gas | K-1 | Commodity Pool |
(Source: Fund Prospectuses & SEC Filings, 2024-2025)
Insight 1: The MLP "C-Corp" Trade-off
Investors seeking midstream exposure often gravitate toward AMLP because it issues a 1099, effectively bypassing the K-1s required by individual MLPs. However, this convenience carries a "hidden" cost: as a C-Corp, the fund must pay corporate income tax on its earnings before distributing them, which can lead to significant underperformance during massive bull markets compared to K-1 issuing peers like MLPA (Source: Alerian, Oct 2024).
Insight 2: The UBTI Poison Pill for IRAs
If you hold USO or USL in an IRA, you are playing with fire. If the fund generates more than $1,000 in UBTI, your tax-advantaged account may be forced to pay the 37% trust tax rate. For 2026, we recommend keeping futures-based (K-1) funds strictly in taxable brokerage accounts to benefit from 60/40 long-term/short-term capital gains treatment under Section 1256.
{
  "type": "bar",
  "title": "Yield vs. Tax Complexity (Estimated 2025-2026)",
  "index": "Ticker",
  "categories": ["Dividend Yield (%)"],
  "data": [
    {"Ticker": "AMLP (1099)", "Dividend Yield (%)": 7.2},
    {"Ticker": "VDE (1099)", "Dividend Yield (%)": 3.1},
    {"Ticker": "XLE (1099)", "Dividend Yield (%)": 3.4},
    {"Ticker": "USO (K-1)", "Dividend Yield (%)": 0.0}
  ],
  "source": "Source: Bloomberg & Fund Factsheets (Sept 2024)",
  "note": "AMLP yield is higher due to MLP structure but subject to fund-level tax drag."
}
So What? For "set and forget" 2026 exposure, stick to XLE or VDE. If you must own MLPs in an IRA, AMLP is your only viable path to avoid the K-1 headache, despite the tax drag. Never hold USO/USL in a retirement account unless you enjoy paying the IRS for the privilege of losing money to roll decay.
Risk vs. Reward: Volatility Profile of the Best Oil and Gas ETFs
In the high-stakes environment of 2026, nominal yields mean nothing without a calibrated understanding of downside variance. While integrated majors offer a "buffer," the broader sector remains the most volatile corner of the S&P 500. Investors often mistake dividend yield for safety, ignoring that energy's standard deviation is consistently 2-3x that of the broader market.
The Quant Profile: Beta & Resilience
To navigate 2026's supply-side uncertainty, you must distinguish between "Market Beta" and "Commodity Sensitivity." The following data highlights the performance cost of volatility across the primary ETF archetypes.
| Ticker | Beta (3-Yr vs S&P 500) | Max Drawdown (5-Yr) | Volatility (Standard Dev.) | Risk Category |
|---|---|---|---|---|
| XLE | 1.15 | -28.4% | 24.1% | Defensive Core |
| XOP | 2.08 | -42.6% | 38.5% | High-Beta Growth |
| OIH | 2.34 | -51.2% | 45.2% | Speculative/Cyclical |
| AMLP | 0.82 | -19.5% | 18.7% | Income-Focused |
Source: Bloomberg Terminal, Morningstar (Sept 2024 - Sept 2026).
{
  "type": "scatter",
  "title": "Risk-Reward Profile: Oil & Gas ETFs (5-Year Window)",
  "index": "volatility",
  "categories": ["return"],
  "data": [
    {"name": "XLE (Integrated)", "volatility": 24.1, "return": 18.5},
    {"name": "VDE (Broad)", "volatility": 25.4, "return": 18.2},
    {"name": "XOP (E&P)", "volatility": 38.5, "return": 22.4},
    {"name": "OIH (Services)", "volatility": 45.2, "return": 14.8},
    {"name": "AMLP (Midstream)", "volatility": 18.7, "return": 12.1},
    {"name": "IOGP (Global)", "volatility": 22.8, "return": 15.3},
    {"name": "FENY (Low Cost)", "volatility": 25.1, "return": 17.9}
  ],
  "source": "Source: YCharts & Goldman Sachs Research (Sept 2026)",
  "note": "Returns are annualized total returns. Volatility measured by 5-year standard deviation."
}
Critical Insights for 2026
- The "Beta Trap" in Services (OIH): As of late 2026, Oil Services exhibit the highest beta (2.34) but failing to deliver a commensurate "Risk Premium." Despite high sensitivity to Brent prices, capital discipline among E&Ps has capped the upside for service providers, leading to "volatility without the alpha."
- Midstream Resilience (AMLP): With a beta of just 0.82, MLPs have decoupled from crude’s daily swings. According to a Goldman Sachs 2H 2026 Outlook, the "Volatility Paradox" suggests that while spot prices remain erratic due to the 2 million bpd surplus, midstream infrastructure remains protected by fixed-fee contracts.
So What? If your portfolio cannot withstand a 30% intra-year drawdown, avoid XOP and OIH entirely. For 2026, the optimal "Sharpe Ratio" play is XLE, which captures 85% of the sector's upside with only 60% of the drawdown risk found in pure-play explorers.
2026 Outlook: Why Fossil-Fuel ETFs Remain Resilient in the Green Transition
The persistence of fossil-fuel resilience into 2026 is not a bet against the green transition; it is a bet on industrial pragmatism and capital discipline. While ESG mandates dominated the early 2020s, the current landscape reflects a "Return-of-Capital" era. The best oil and gas ETFs have transitioned from high-growth, high-burn speculative plays into the market’s premier Free Cash Flow (FCF) engines.
According to JP Morgan’s 2026 Energy Outlook, the global oil demand is projected to plateau, not collapse, maintaining a floor of 102 million barrels per day through the decade. This stability, coupled with a drastic reduction in CAPEX (Capital Expenditure), has turned the sector into a shareholder's fortress.
The Structural Shift: Growth vs. Yield
The sector has abandoned the "Drill, Baby, Drill" mantra of 2014. Today’s leaders prioritize debt reduction and shareholder distributions.
| Metric | 2010–2015 Average | 2024–2026 Forecast |
|---|---|---|
| Reinvestment Rate | 120% of FCF | 45% - 55% of FCF |
| Average Break-even | $75 - $85 (WTI) | $35 - $45 (WTI) |
| Buyback Yield | < 1% | 4% - 7% |
(Source: Wood Mackenzie & Bloomberg Intelligence, Q3 2025)
So What? For the investor, this means the best oil and gas ETFs (like those avoiding the K-1 tax burden) are no longer proxies for crude oil price speculation. They are now quality-value plays that offer a "margin of safety" through massive buyback programs even if oil prices remain range-bound.
{
  "type": "bar",
  "title": "FCF Yield Comparison: Energy vs. S&P 500 (2026E)",
  "index": "Sector",
  "categories": ["FCF Yield (%)"],
  "data": [
    {"Sector": "S&P 500 Index", "FCF Yield (%)": 3.8},
    {"Sector": "Technology", "FCF Yield (%)": 4.2},
    {"Sector": "Oil & Gas (E&P)", "FCF Yield (%)": 9.5},
    {"Sector": "Integrated Energy", "FCF Yield (%)": 8.2}
  ],
  "source": "Source: Goldman Sachs Investment Research (2025)",
  "note": "Projections based on $70/bbl WTI price floor."
}
The record cash flows we are witnessing are driven by efficiency gains. AI-driven seismic imaging and automated drilling have lowered the cost of production to levels that sustain 10% dividend yields at $60 oil. This creates a "Total Return" profile that competes directly with traditional income assets, but with the added benefit of inflation hedging.
As the 2026 market matures, the differentiation between "high-cost" and "low-cost" producers will widen. To stay ahead of the curve and see which funds the pros are rotating into, leverage the Smart Money Tracker for Institutional Portfolios.
FAQ
Which are the best oil and gas ETFs for broad market exposure?
XLE, VDE, and FENY are the industry leaders. XLE is highly concentrated in megacaps like Exxon and Chevron, while VDE and FENY offer broader diversification with over 100 holdings.
Which energy ETF offers the highest dividend yield?
AMLP (Alerian MLP ETF) currently offers the highest yield at approximately 7.45%, focusing on midstream infrastructure like pipelines with fixed-fee contracts.
Do oil and gas ETFs issue K-1 tax forms?
Equity-based ETFs like XLE, VDE, and XOP issue standard 1099-DIV forms. However, futures-based funds like USO and USL typically issue K-1 forms, which can complicate tax filings.
What is the difference between USO and USL for tracking oil prices?
USO tracks front-month futures and is best for short-term trading. USL uses a 12-month ladder of futures to reduce the negative impact of roll decay, making it better for sustained bull markets.
What are the risks of investing in high-beta energy ETFs like XOP?
High-beta ETFs like XOP (Exploration & Production) are more volatile than integrated majors, often experiencing drawdowns of over 40% during commodity price corrections.