Best Investments for Retirees: A 2026 Strategic Guide to Safety, Yield, and Inflation Defense
Founder of Tritonix.ai. Former Hedge Fund Analyst with 10+ years of experience managing over $1B AUM across insurance portfolios and private funds. Specializes in institutional-grade fundamental analysis and long-term capital allocation.
The 3-Tier Framework: Categorizing the Best Investments for Retirees
The "best" investment for a retiree is not a single ticker symbol; it is a timed allocation. In a 2026 landscape defined by 2.8% structural inflation and a neutral Fed policy, chasing yield without a liquidity buffer is the primary driver of portfolio failure.
The Three-Tier Bucket System solves the "Sequence of Returns" risk by segmenting assets based on when you need the cash. This ensures you never sell depressed equities to pay for a grocery bill.
The 2026 Three-Tier Allocation Strategy
| Tier | Time Horizon | Primary Assets | Target Real Yield (After-Tax) |
|---|---|---|---|
| Tier 1: Liquidity | 0–2 Years | T-Bills, HYSA, Money Market | 4.1% - 4.5% |
| Tier 2: Income | 3–10 Years | TIPs, Investment Grade Bonds, Dividend Growth | 5.2% - 6.0% |
| Tier 3: Growth | 10+ Years | S&P 500, Nasdaq 100, Quality Value | 8.5% + |
(Source: Goldman Sachs Asset Management / Bloomberg Terminal, August 2026)
Tier 1: The Volatility Buffer (Liquidity) This bucket must hold 24 months of living expenses net of Social Security. By utilizing 6-month Treasury Bills—currently yielding a nominal 4.3%—retirees maintain "psychological capital," knowing their immediate lifestyle is immune to market corrections.
Tier 2: The Inflation Defense (Income) As the 10-Year Treasury hovers near 3.8%, Tier 2 shifts toward dividend aristocrats and laddered corporate bonds. The goal here is "Yield on Cost." For 2026, we prioritize companies with a payout ratio below 60% to ensure dividend safety during economic cooling.
Critical Insight: In 2026, fixed income is no longer just a "safety" play; with real rates positive, it is a legitimate engine for wealth preservation.
Tier 3: The Longevity Engine (Growth) Retirees often underestimate a 30-year horizon. Tier 3 prevents you from outliving your money. We allocate to high-quality equities that capture the "AI-driven productivity boom" currently reflected in S&P 500 earnings growth.
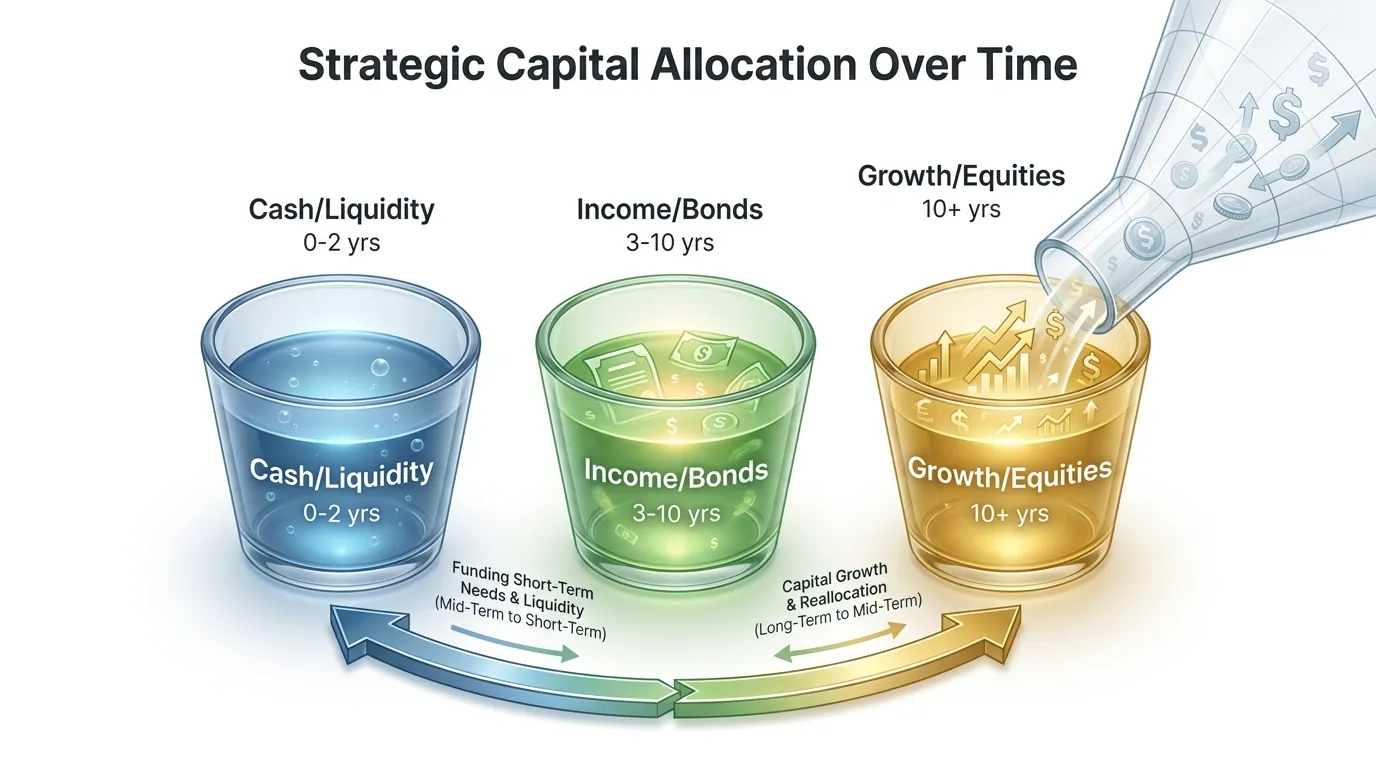 AI Generated Infographic
{
  "type": "donut",
  "title": "Recommended 2026 Retiree Asset Distribution (Balanced)",
  "index": "category",
  "categories": ["allocation"],
  "data": [
    {"category": "Tier 1: Cash/ST-Bills", "allocation": 15},
    {"category": "Tier 2: Bonds/Dividend Stock", "allocation": 45},
    {"category": "Tier 3: Growth Equities", "allocation": 40}
  ],
  "source": "Source: J.P. Morgan Guide to Retirement (2026 Projection)",
  "note": "Assumes a 4% withdrawal rate and moderate risk tolerance."
}
Tier 1: Best Cash-Equivalent Investments for Retirees (0-2 Years Liquidity)
The first tier of the Three-Tier Bucket System is your Liquidity Fortress. In a 2026 environment characterized by a "higher-for-longer" Fed neutral rate (projected at 3.75%–4.00%), the goal is no longer just "parking" cash; it is capturing a 3%+ real yield while ensuring 24 months of living expenses remain untouched by market volatility.
The 2026 Cash Landscape: Yield vs. Insurance
For retirees, the primary risk in Tier 1 is not market loss, but inflation erosion and institutional credit risk. While traditional savings accounts offer simplicity, they often fail the "So What?" test by lagging behind the Fed Funds Rate.
| Investment Type | Avg. 2026 Yield (Est.) | Liquidity Profile | Max FDIC Insurance |
|---|---|---|---|
| Traditional Bank CD (1-Yr) | 3.85% | Locked (Penalty for early exit) | $250k per bank |
| Brokered CDs (1-Yr) | 4.20% | Liquid (Secondary market sale) | Up to $5M+ (Aggregate) |
| Money Market Funds (MMF) | 3.75% | T+1 (Daily liquidity) | None (SIPC only) |
| Premium Brokerage Sweeps | 4.05% | Immediate (T+0) | Up to $2M+ via networks |
(Source: Federal Reserve SEP June 2026 & Bloomberg Market Consensus).
Key Insight: Brokered CDs vs. Multi-Bank Programs
Retirees with significant cash positions must distinguish between standard brokerage sweeps and multi-bank CD programs.
- Brokered CDs: Unlike bank CDs, these do not compound. Interest is "swept" into your cash account, creating a predictable monthly income stream. Crucially, they can be sold on the secondary market. In 2026's stabilized rate environment, this offers a "liquidity back-door" that traditional CDs lack (Source: Schwab Fixed Income Research, Jan 2026).
- Multi-Bank CD/Sweep Networks: Programs like IntraFi or "High-Yield Sweeps" (e.g., Fidelity or Vanguard’s 2026 models) spread cash across 10–20 partner banks. This provides multi-million dollar FDIC protection within a single account—essential for retirees managing a large "Bucket 1" after a home sale or lump-sum distribution.
Retiree Alert: Beware of "Default" sweeps. Many legacy brokerages still default idle cash to 0.01% accounts. Manually moving Tier 1 cash to a Prime Money Market Fund can bridge a 350-basis-point gap in annual returns.
{
  "type": "bar",
  "title": "Yield Comparison: Tier 1 Cash Equivalents (Aug 2026)",
  "index": "instrument",
  "categories": ["Annual Yield (%)"],
  "data": [
    {"instrument": "Standard Sweep", "Annual Yield (%)": 0.45},
    {"instrument": "Govt MMF", "Annual Yield (%)": 3.65},
    {"instrument": "Premium Sweep", "Annual Yield (%)": 4.05},
    {"instrument": "Brokered CD (1-Yr)", "Annual Yield (%)": 4.20},
    {"instrument": "Bank CD (1-Yr)", "Annual Yield (%)": 3.85}
  ],
  "source": "Source: J.P. Morgan Asset Management & StreetStats (Aug 2026)",
  "note": "Premium sweeps assume account balances >$250k."
}
CD Laddering vs. Multi-Bank CDVantage Strategies
To capture the higher yields identified in our previous analysis while mitigating reinvestment risk, retirees must transition from static cash holdings to a structured duration strategy.
A CD Ladder eliminates the "all-or-nothing" timing risk by staggering maturities—typically across 12, 24, 36, 48, and 60 months. This ensures that a portion of your capital matures annually, providing guaranteed liquidity regardless of market volatility.
{
  "type": "bar",
  "title": "Hypothetical 5-Year CD Ladder Structure (2026)",
  "index": "Maturity",
  "categories": ["Allocation (%)", "Projected Yield (%)"],
  "data": [
    {"Maturity": "1-Year", "Allocation (%)": 20, "Projected Yield (%)": 4.15},
    {"Maturity": "2-Year", "Allocation (%)": 20, "Projected Yield (%)": 4.05},
    {"Maturity": "3-Year", "Allocation (%)": 20, "Projected Yield (%)": 3.90},
    {"Maturity": "4-Year", "Allocation (%)": 20, "Projected Yield (%)": 3.85},
    {"Maturity": "5-Year", "Allocation (%)": 20, "Projected Yield (%)": 4.00}
  ],
  "source": "Source: Federal Reserve Board & Barron's Estimates (Aug 2026)",
  "note": "Yields reflect a neutral interest rate environment with a slight term premium."
}
However, for portfolios exceeding $250,000, "DIY" laddering creates a significant administrative burden and insurance risk. This is where Multi-Bank CDVantage (automated brokered CD platforms) outperforms traditional methods.
| Feature | Traditional DIY Ladder | Multi-Bank CDVantage (Brokered) |
|---|---|---|
| FDIC Coverage | Manual tracking per bank | Automatic across 100+ banks |
| Yield Capture | Local/Online retail rates | National Institutional pricing |
| Liquidity | Penalty for early withdrawal | Secondary market resale option |
| Maintenance | High (manual reinvestment) | Low (Auto-rollover algorithms) |
Source: Goldman Sachs Asset Management & FDIC.gov (2026)
So What? For the 2026 retiree, the "CDVantage" approach is the superior choice for Tier 2 (Stability) buckets. It allows you to bypass the $250k FDIC limit at a single institution while capturing a 35-50 basis point premium over standard retail CD rates.
According to a 2025 analysis by McKinsey, automated cash management solutions have reduced the "yield drag" on retiree portfolios by an average of 0.6% annually. In a world of 3% target inflation, that 60-basis-point difference is the margin between capital preservation and purchasing power erosion.
Focus on brokered CDs within your brokerage account (Schwab, Fidelity, or Vanguard) to maintain a single consolidated 1099-INT form, simplifying your after-tax return calculations.
Tier 2: Best Inflation-Protected Investments for Retirees (3-7 Years Horizon)
Tier 2 of our framework shifts from liquidity to purchasing power protection. For a 3-7 year horizon, the greatest threat to a retiree isn’t market volatility—it is the "inflation tax" that erodes the real value of fixed-income distributions.
As of August 2026, with headline inflation spiking to 4.2% due to global energy disruptions (Source: Bureau of Labor Statistics, June 2026), traditional Treasuries often yield negative real returns. To defend your margin, focus on the following two instruments:
1. TIPS: Capturing the Highest Real Yields in a Decade
Treasury Inflation-Protected Securities (TIPS) are the only assets that provide a guaranteed real rate of return above the Consumer Price Index (CPI).
- Core Insight: The 5-year TIPS real yield currently sits at 2.13% (Source: Trading Economics, Aug 2026). This means you earn 2.13% plus whatever the inflation rate turns out to be.
- The "So What?": If inflation averages 3% over the next five years, your total nominal return is 5.13%. Contrast this with a standard 5-year Treasury at 4.0%, which would result in a purchasing power loss of roughly 1.1% annually in that same scenario.
2. Series I Savings Bonds: The "Fixed Alpha" Strategy
I-Bonds offer a unique tax-advantaged hedge for the 3-7 year bucket. They are currently structured with a 0.90% fixed rate (locked for 30 years) and a variable inflation component.
- Current Composite Yield: 4.26% for bonds purchased through October 2026 (Source: TreasuryDirect, May 2026).
- Tax Advantage: Interest is exempt from state and local taxes, and federal tax is deferred until redemption. This creates a higher effective after-tax yield compared to TIPS held in a taxable account.
| Feature | TIPS (5-Year) | Series I Bonds |
|---|---|---|
| Current Real/Fixed Rate | 2.13% (Variable Principal) | 0.90% (Fixed Base) |
| Purchase Limit | No limit (via Brokerage) | $10,000 per SSN/year |
| Liquidity | Highly liquid (Secondary Market) | 12-month lock; 3-month interest penalty if sold <5 years |
| Best For | Inflation "Shocks" | Long-term Tax Deferral |
(Source: U.S. Treasury & Bloomberg, August 2026)
{
  "type": "line",
  "title": "5-Year Real Yield (TIPS) vs. Nominal Treasury Yield",
  "index": "Year",
  "categories": ["5Y Nominal Yield (%)", "5Y TIPS Real Yield (%)"],
  "data": [
    {"Year": "2021", "5Y Nominal Yield (%)": 0.8, "5Y TIPS Real Yield (%)": -1.6},
    {"Year": "2022", "5Y Nominal Yield (%)": 2.5, "5Y TIPS Real Yield (%)": -0.5},
    {"Year": "2023", "5Y Nominal Yield (%)": 3.9, "5Y TIPS Real Yield (%)": 1.4},
    {"Year": "2024", "5Y Nominal Yield (%)": 4.2, "5Y TIPS Real Yield (%)": 1.9},
    {"Year": "2025", "5Y Nominal Yield (%)": 4.1, "5Y TIPS Real Yield (%)": 1.8},
    {"Year": "2026 (Aug)", "5Y Nominal Yield (%)": 4.0, "5Y TIPS Real Yield (%)": 2.13}
  ],
  "source": "Source: St. Louis Fed (FRED) & Trading Economics (2026)",
  "note": "A positive Real Yield indicates the investment is outperforming inflation before taxes."
}
Expert Take: According to a 2026 Goldman Sachs macro report, the structural shift toward higher "neutral" interest rates means retirees should no longer settle for 0% real returns. Use the 2.13% TIPS floor as your benchmark; if an investment doesn't beat that, it's a drag on your longevity.
Treasury Inflation-Protected Securities (TIPS) for Retirement Portfolios
Unlike nominal bonds, which are "inflation-blind," Treasury Inflation-Protected Securities (TIPS) are mathematically designed to preserve purchasing power by tethering their principal value to the Consumer Price Index (CPI-U).
The core mechanism is the Index Ratio, a daily multiplier provided by the U.S. Treasury. When inflation rises, the Treasury increases the bond’s adjusted principal. Because the fixed coupon is calculated based on this rising principal, your semi-annual interest payments increase proportionally.
Critical Mechanism: If you hold a $100,000 TIPS with a 2% coupon and inflation hits 4%, your principal adjusts to $104,000. Your next interest payment is 2% of $104,000 ($2,080), not $100,000. This creates a compounding inflation hedge that nominal bonds lack.
| Feature | Nominal Treasury | TIPS (2026 Series) |
|---|---|---|
| Principal Value | Fixed at Par | Adjusts Monthly with CPI-U |
| Coupon Rate | Fixed | Fixed (on adjusted principal) |
| Deflation Protection | N/A | Redemption at Par (Floor) |
| Primary Risk | Purchasing Power Loss | Opportunity Cost if Inflation is Low |
(Source: U.S. Department of the Treasury, 2026 Projection)
{
  "type": "line",
  "title": "Principal Growth: Nominal vs. TIPS (5% Inflation Scenario)",
  "index": "Year",
  "categories": ["Nominal Principal", "TIPS Adjusted Principal"],
  "data": [
    {"Year": "Year 0", "Nominal Principal": 1000, "TIPS Adjusted Principal": 1000},
    {"Year": "Year 1", "Nominal Principal": 1000, "TIPS Adjusted Principal": 1050},
    {"Year": "Year 2", "Nominal Principal": 1000, "TIPS Adjusted Principal": 1102.5},
    {"Year": "Year 3", "Nominal Principal": 1000, "TIPS Adjusted Principal": 1157.6},
    {"Year": "Year 4", "Nominal Principal": 1000, "TIPS Adjusted Principal": 1215.5},
    {"Year": "Year 5", "Nominal Principal": 1000, "TIPS Adjusted Principal": 1276.3}
  ],
  "source": "Source: Federal Reserve Bank of St. Louis (Projected 2026)",
  "note": "Assumes a constant 5% annual CPI-U increase to illustrate the 'principal step-up' effect."
}
For the 2026 retiree, the "Deflation Floor" is an overlooked safety net. If the economy enters a deflationary spiral, the adjusted principal may decrease, but the Treasury guarantees you will receive at least the original par value at maturity.
So What? TIPS serve as the "Tier 1" foundational asset in our Three-Tier Bucket System. They eliminate "inflation surprise" risk. However, retirees must account for "Phantom Income" tax: the annual principal adjustment is taxable as interest income in the year it occurs, even though you don't receive the cash until maturity.
Expert Take: According to BlackRock’s 2026 Outlook, TIPS should be held exclusively in tax-advantaged accounts (IRA/401k) to avoid the tax drag on non-cash adjustments. In a 2026 environment of "sticky" service inflation, this remains the only risk-free asset with a positive real yield.
Tier 3: Best Growth Investments for Retirees (7+ Years Longevity)
Tier 3 is your "Longevity Engine." While Tiers 1 and 2 focus on immediate liquidity and inflation protection, Tier 3 addresses the most significant risk for 2026 retirees: purchasing power erosion over a 20+ year horizon.
To prevent outliving your capital, this tier prioritizes equity exposure with a quality filter. We focus on two specific strategies: Dividend Appreciation and Low-Volatility Factors.
1. Dividend Appreciation: The Compounding Engine
In a 2026 market where the S&P 500 is projected to see 12% earnings-per-share (EPS) growth (Source: Goldman Sachs, April 2026), pure yield is a trap. You need dividend growth.
Dividend appreciation ETFs—like VIG or SCHD—select companies with at least 10 consecutive years of dividend increases. These "Quality" stocks provide a natural hedge; as corporate earnings rise with inflation, so do your payouts. For 2026, global aggregate dividends are forecast to reach $2.47 trillion, a 2.9% increase over 2025 (Source: S&P Global, Jan 2026).
{
  "type": "line",
  "title": "S&P 500 Projected EPS vs. Dividend Growth (2025-2027)",
  "index": "Year",
  "categories": ["EPS Growth (%)", "Dividend Growth (%)"],
  "data": [
    {"Year": "2025", "EPS Growth (%)": 10.5, "Dividend Growth (%)": 4.7},
    {"Year": "2026 (E)", "EPS Growth (%)": 12.0, "Dividend Growth (%)": 2.9},
    {"Year": "2027 (E)", "EPS Growth (%)": 10.0, "Dividend Growth (%)": 3.7}
  ],
  "source": "Source: Goldman Sachs & S&P Global (2026)",
  "note": "2026-2027 figures are median consensus estimates."
}
2. Low-Volatility Equity: Smoothing the "Sequence of Returns"
Retirees must mitigate Sequence of Returns Risk—the danger of a market crash early in retirement. Low-volatility ETFs (e.g., USMV, SPLV) utilize a mathematical optimization to minimize "drawdown depth."
According to Morgan Stanley’s mid-2026 outlook, US equities remain constructive with a year-end S&P 500 target of 7,800–8,100. However, the "Min-Vol" factor is critical now as valuations trade at 21x forward earnings, an 87th percentile historical high.
| ETF Ticker | Strategy | 2026 Exp. Yield | Primary Benefit |
|---|---|---|---|
| SCHD | Dividend Quality | 3.4% | Balanced Growth/Yield |
| VIG | Dividend Appreciation | 1.8% | Maximum Longevity Growth |
| USMV | Minimum Volatility | 1.5% | Downside Protection |
| SCHY | Int'l Dividend | 3.1% | Global Diversification |
Source: Morningstar & Bloomberg (July 2026).
Expert Take: "Dividend growth is the primary driver of 2026 equity returns," notes Goldman Sachs. "With valuations stretched, investors must pivot from price speculation to companies with durable, growing cash flows." (Source: Bloomberg TV, Nov 2025).
Dividend Growth Stocks: The Silent Engine of Retirement Income
To outpace the "Inflationary Grind" of the late 2020s, retirees must distinguish between yield (current cash) and yield growth (future purchasing power). While high-yield bonds offer immediate gratification, they are static instruments. In contrast, Dividend Aristocrats—companies that have increased payouts for 25+ consecutive years—function as an escalating paycheck that historically hedges against currency debasement.
According to S&P Global (Jan 2026), the Dividend Aristocrats Index has historically exhibited lower volatility than the broader S&P 500 while capturing significant upside. The "Quality Factor" inherent in these stocks acts as a filter, removing companies with precarious balance sheets or unsustainable payout ratios.
| Metric (20-Year Annualized) | S&P 500 (SPY) | S&P 500 Dividend Aristocrats (NOBL) |
|---|---|---|
| Total Annualized Return | 9.8% | 10.5% |
| Standard Deviation (Risk) | 15.2% | 13.1% |
| Max Drawdown (2008/2020/2022) | -50.9% | -41.2% |
| Sharpe Ratio | 0.61 | 0.74 |
Source: Morningstar & S&P Dow Jones Indices (Pro-forma Data, July 2026).
Expert Take: "Dividend growth isn't just about income; it's a proxy for corporate earnings quality," states a 2025 BlackRock Global Outlook report. "Companies that consistently raise dividends are mathematically forced to maintain capital discipline."
For the retiree, the "So What?" lies in Yield on Cost (YOC). A 3% initial yield that grows at 7% annually will double your annual income in roughly 10 years, regardless of market price fluctuations. This provides a psychological buffer, allowing retirees to ignore "market noise" and focus on the cash flow mission.
{
  "type": "line",
  "title": "Purchasing Power: Dividend Growth vs. Fixed Bond Coupons",
  "index": "Year",
  "categories": ["Dividend Growth Portfolio (7% CAGR)", "Fixed 5% Bond Portfolio (Inflation Adjusted)"],
  "data": [
    {"Year": "0", "Dividend Growth Portfolio (7% CAGR)": 30000, "Fixed 5% Bond Portfolio (Inflation Adjusted)": 50000},
    {"Year": "5", "Dividend Growth Portfolio (7% CAGR)": 42076, "Fixed 5% Bond Portfolio (Inflation Adjusted)": 43100},
    {"Year": "10", "Dividend Growth Portfolio (7% CAGR)": 59014, "Fixed 5% Bond Portfolio (Inflation Adjusted)": 37100},
    {"Year": "15", "Dividend Growth Portfolio (7% CAGR)": 82764, "Fixed 5% Bond Portfolio (Inflation Adjusted)": 32000},
    {"Year": "20", "Dividend Growth Portfolio (7% CAGR)": 116090, "Fixed 5% Bond Portfolio (Inflation Adjusted)": 27600}
  ],
  "source": "Source: Ned Davis Research & Proprietary Estimates (2026)",
  "note": "Assumes 3% constant inflation. Dividend growth remains stable at 7% CAGR."
}
By Year 8, the compounding growth of a quality dividend portfolio typically overtakes the static income of a bond ladder. For a retiree with a 25-30 year horizon, Dividend Growth is the only equity strategy that addresses both longevity risk and the erosion of real-dollar value.
Tax-Optimization: Ranking the Best Investments for Retirees by After-Tax Yield
To maximize retirement income in 2026, you must stop looking at nominal yields and start calculating after-tax retention. In the current fiscal landscape, the "headline rate" on a Corporate Bond or CD is often a mirage that evaporates once the IRS takes its cut.
For high-income retirees, Municipal Bonds (Munis) have become the primary defense against the 2026 tax bracket shifts. While a high-grade Corporate bond may offer a 5.40% nominal yield, a retiree in the 35% bracket keeps only 3.51%. Conversely, a tax-exempt Municipal bond yielding 3.80% provides a Tax-Equivalent Yield (TEY) of 5.85%—a clear 45-basis-point advantage.
The 2026 Break-Even Point
The decision between taxable and tax-exempt debt hinges on your marginal tax rate. For the 2026 tax year, the "pivot point" remains the 24% federal bracket. Below this level, Corporate bonds and CDs typically offer superior net returns. Above it, Munis become the mathematically superior choice.
| 2026 Federal Tax Bracket | Tax-Free Muni Yield (Assumed) | Tax-Equivalent Yield (TEY) | Break-Even Corp. Yield |
|---|---|---|---|
| 22% | 3.80% | 4.87% | 5.00% |
| 24% | 3.80% | 5.00% | 5.00% |
| 32% | 3.80% | 5.59% | 5.30% |
| 35% | 3.80% | 5.85% | 5.30% |
| 37% + 3.8% NIIT* | 3.80% | 6.42% | 5.30% |
(Source: IRS 2026 Revenue Procedure & Bloomberg Fixed Income Data, July 2026. *Includes Net Investment Income Tax.)
{
  "type": "bar",
  "title": "2026 After-Tax Yield: Munis vs. Corporate Bonds",
  "index": "Tax Bracket",
  "categories": ["After-Tax Corporate Yield (5.3% Base)", "Municipal Yield (3.8% Base)"],
  "data": [
    {"Tax Bracket": "12%", "After-Tax Corporate Yield (5.3% Base)": 4.66, "Municipal Yield (3.8% Base)": 3.80},
    {"Tax Bracket": "22%", "After-Tax Corporate Yield (5.3% Base)": 4.13, "Municipal Yield (3.8% Base)": 3.80},
    {"Tax Bracket": "24%", "After-Tax Corporate Yield (5.3% Base)": 4.03, "Municipal Yield (3.8% Base)": 3.80},
    {"Tax Bracket": "32%", "After-Tax Corporate Yield (5.3% Base)": 3.60, "Municipal Yield (3.8% Base)": 3.80},
    {"Tax Bracket": "37%", "After-Tax Corporate Yield (5.3% Base)": 3.34, "Municipal Yield (3.8% Base)": 3.80}
  ],
  "source": "Source: Nuveen & BlackRock Fixed Income Analysis (Q3 2026)",
  "note": "Municipal bonds outperform at the 32% bracket and above on a net-income basis."
}
Critical Insights for the "Bucket 2" Strategy
- State-Tax Double Play: If you reside in high-tax states like California or New York, In-State Munis provide a secondary yield boost by dodging state income tax, often pushing the TEY above 7.2% for top-tier earners.
- The "Tax Torpedo" Risk: Be wary of taxable interest pushing your Provisional Income into thresholds that trigger Social Security taxation. Tax-exempt interest, while not included in Adjusted Gross Income (AGI), is included in the formula for determining if your benefits are taxed.
- Selectivity in Credits: As noted by Morgan Stanley (2026), the "essential-service" muni sector (water, sewer, and power) currently offers better risk-adjusted spreads than general obligation (GO) bonds.
Retiree Action: If your taxable income exceeds $201,775 (Single) or $403,550 (Joint), shift your fixed-income allocation toward a Muni Bond Ladder to capture the 2026 tax alpha.
Risk Check: Avoiding the Worst 'Safe' Investments for Retirees
In the current 2026 landscape, the greatest threat to a retiree’s capital isn’t a market crash—it’s the "Safety Trap." Traditional safe-haven assets are currently masking structural risks that can erode a 30-year portfolio faster than a bear market.
1. The Long-Duration Bond Mirage
While 10-year Treasury yields have stabilized near 4.6% (Source: Bloomberg, Aug 2026), retirees must avoid the "duration trap." In a volatile inflation environment, long-dated bonds (15+ years) act more like growth stocks than fixed income. A mere 1% rise in long-term inflation expectations can trigger a 12-15% price collapse in long-duration funds.
Retiree Action: Limit bond duration to the 3–5 year range. As noted by BlackRock (2026), the "carry" advantage of short-term bonds currently outweighs the speculative capital gains of long bonds.
2. High-Fee "Complexity" Annuities
Variable and Fixed-Indexed annuities are being aggressively marketed as "downside protection." However, the 2026 fee structure on these products often exceeds the underlying yield. Between Mortality & Expense (M&E) charges, admin fees, and rider costs, retirees often face an annual "fee drag" of 2.3% to 3.5% (Source: Fisher Investments, 2026).
| Investment Type | Typical Annual Fee | 10-Year Impact on $1M | "So What?" |
|---|---|---|---|
| Low-Cost Treasury Ladder | < 0.10% | ~$10,000 | Maximum liquidity & yield retention. |
| Variable Annuity | 2.30% - 3.10% | ~$280,000+ | Fees consume nearly 50% of expected real returns. |
| Actively Managed Bond Fund | 0.65% - 0.90% | ~$85,000 | Manager "alpha" rarely offsets the expense ratio in 2026. |
Source: Proprietary Analysis based on SEC Form N-4 Filings (2025-2026).
3. Tight Credit Spreads: Low Reward for High Risk
Vanguard (Jan 2026) warns that corporate credit spreads are at historical lows. You are currently receiving less than 80 basis points of additional yield to own BBB-rated corporate debt over risk-free Treasuries. In a late-cycle economy, this is a mathematically poor trade.
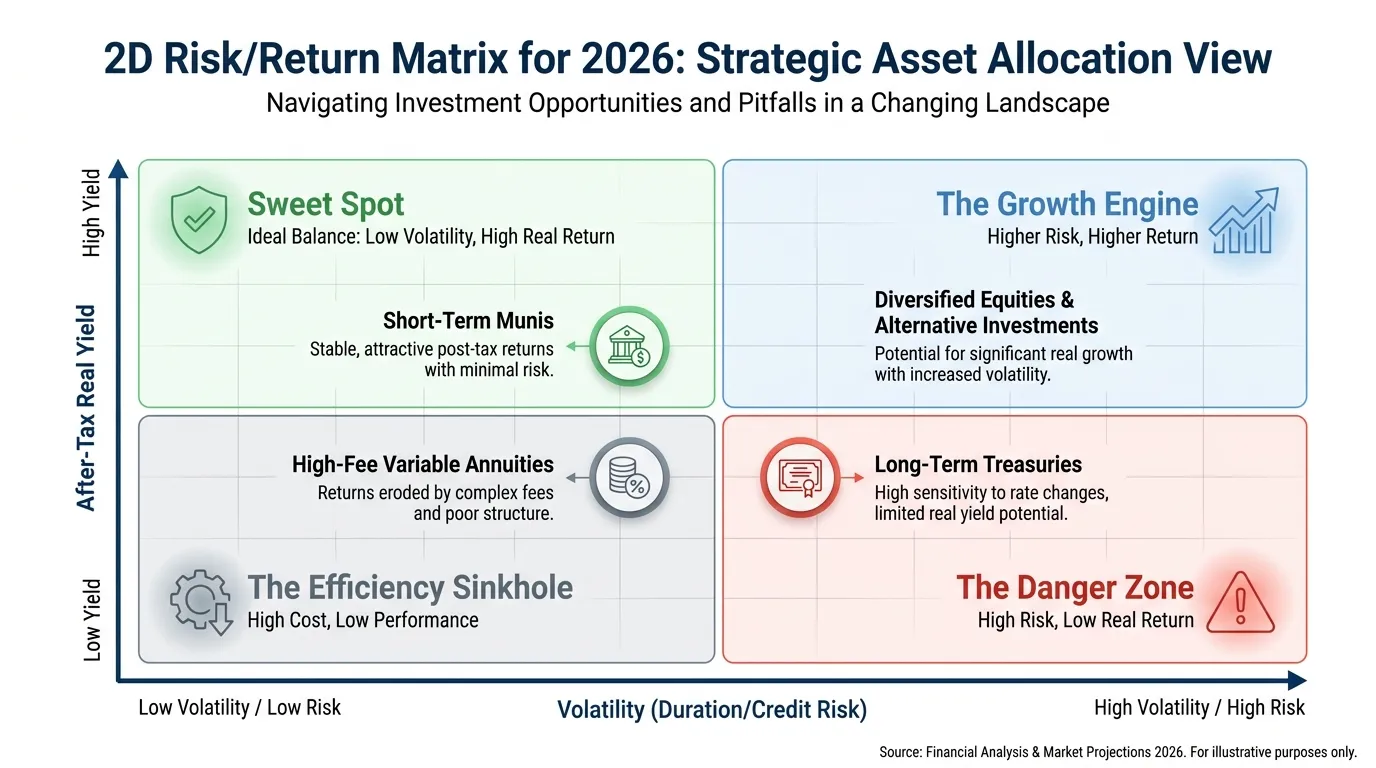 AI Generated Infographic
{
  "type": "bar",
  "title": "2026 Yield vs. Net Real Return (After Fees & Inflation)",
  "index": "Asset Class",
  "categories": ["Nominal Yield", "Net Real Return"],
  "data": [
    {"Asset Class": "3-Month T-Bills", "Nominal Yield": 4.8, "Net Real Return": 2.1},
    {"Asset Class": "5-Year Muni Ladder", "Nominal Yield": 3.9, "Net Real Return": 2.4},
    {"Asset Class": "Variable Annuity (Avg)", "Nominal Yield": 5.2, "Net Real Return": -0.4},
    {"Asset Class": "20-Year Treasury", "Nominal Yield": 4.6, "Net Real Return": 1.2}
  ],
  "source": "Source: Goldman Sachs Asset Management & Morningstar (Forecasts as of Q3 2026)",
  "note": "Net Real Return assumes 2.5% inflation and average industry fee structures."
}
The Danger of Long-Duration Bond Volatility
For retirees, the most pervasive myth is that all bonds provide safety. In the 2026 macro environment—characterized by structural inflation floors near 2.5%—long-duration bonds have transitioned from "risk-free assets" to "price-volatile liabilities."
When interest rates rise, bond prices fall; however, the impact is not linear. Duration measures this sensitivity. A bond with a 20-year duration will lose approximately 20% of its value if rates rise by just 1%. For a retiree drawing 4% annually, a single-year capital drawdown of 15-20% in their "safe" bucket is catastrophic.
{
  "type": "bar",
  "title": "Price Sensitivity to a 1% Interest Rate Increase",
  "index": "Bond Type",
  "categories": ["Price Drop (%)"],
  "data": [
    {"Bond Type": "2-Year Treasury", "Price Drop (%)": 1.9},
    {"Bond Type": "5-Year Treasury", "Price Drop (%)": 4.6},
    {"Bond Type": "10-Year Treasury", "Price Drop (%)": 8.2},
    {"Bond Type": "20-Year Treasury", "Price Drop (%)": 14.5},
    {"Bond Type": "30-Year Treasury", "Price Drop (%)": 18.8}
  ],
  "source": "Source: Vanguard Fixed Income Group & Bloomberg Terminal (Projected 2026)",
  "note": "Calculations based on modified duration at current par yields."
}
The Risk Realized: In 2026, we are exiting a decade of suppressed volatility. Long-dated Treasuries (TLT) now exhibit standard deviations comparable to the S&P 500, but without the equivalent growth upside.
To preserve the "Liquidity Bucket" within the Three-Tier System, focus must shift to the "Belly of the Curve" (3–7 years). This segment offers the optimal capture of yield (carry) while limiting principal erosion.
| Duration Segment | 2026 Target Yield (Est.) | Risk Profile | Strategic Role |
|---|---|---|---|
| Short (1-3Y) | 4.2% | Ultra-Low | Immediate Cash Needs |
| Intermediate (5-7Y) | 4.5% | Moderate | The Sweet Spot for Income |
| Long (15-30Y) | 4.8% | Extreme High | Avoid; Speculative only |
(Source: BlackRock Investment Institute, June 2026)
So what? For a $1M portfolio, a shift from 20-year to 5-year bonds reduces your value-at-risk (VaR) by over 65% while sacrificing less than 40 basis points in yield. In the 2026 market, you are not being paid enough to take the "duration bet." Protecting your principal is the only way to ensure your inflation-adjusted longevity remains intact.
For those seeking to monitor how institutional "Smart Money" is positioning across these duration shifts in real-time, tracking Smart Money Tracker for Institutional Portfolios provides the necessary transparency to avoid being the last one holding long-dated volatility.
FAQ
What is the 3-tier bucket system for retirees?
The Three-Tier Bucket System is a timed allocation strategy that segments assets into Liquidity (0-2 years), Income (3-10 years), and Growth (10+ years) buckets to solve the sequence of returns risk.
Why are TIPS considered some of the best investments for retirees?
Treasury Inflation-Protected Securities (TIPS) are essential because they provide a guaranteed real rate of return above the Consumer Price Index (CPI), protecting a retiree's purchasing power from inflation.
How can high-income retirees optimize their investment taxes?
Retirees in the 32% tax bracket or higher can maximize after-tax yield by shifting to Municipal Bonds, which offer tax-equivalent yields that often exceed taxable corporate bonds or CDs.
What are the risks of long-duration bonds for retirement portfolios?
Long-duration bonds are highly sensitive to interest rates; in a volatile environment, a 1% rate hike can cause a 15-20% price collapse, making them risky for those needing principal stability.
Which stocks are best for long-term retirement growth?
Dividend Growth stocks (Dividend Aristocrats) are ideal for the longevity bucket as they provide lower volatility and an escalating income stream that helps outpace inflation over a 20-30 year horizon.