The Best Investment Share Market Guide 2026: Why Indexing Beats Gold & AI Hype
Founder of Tritonix.ai. Former Hedge Fund Analyst with 10+ years of experience managing over $1B AUM across insurance portfolios and private funds. Specializes in institutional-grade fundamental analysis and long-term capital allocation.
Defining the 'Best Investment Share Market' Strategy in 2026
By July 2026, the global economy has transitioned into a "higher-for-longer" productivity phase. While inflation has cooled to a 2.8% floor, the era of "easy money" is a memory.
Despite 2024-2025 Gallup sentiment shifts showing a resurgence in gold preference—driven by geopolitical hedging—the equity market remains the only vehicle capable of outstripping the cost of living and capital.
The Performance Reality: 2021–2026
Investors often mistake "stability" for "growth." Gold preserves value, but equities create it. Since 2021, the divergence in total returns—including reinvested dividends—highlights the high opportunity cost of excessive safety.
| Asset Class | 5-Year Total Return (Est.) | Annualized CAGR | Primary Driver |
|---|---|---|---|
| S&P 500 (Equities) | +72.4% | 11.5% | AI-driven margin expansion |
| Physical Gold | +38.2% | 6.7% | Central Bank diversification |
| U.S. Real Estate | +24.1% | 4.4% | Mortgage rate friction |
(Source: Bloomberg Terminal & S&P Global Intelligence, July 2026. Note: Real Estate based on Case-Shiller National Home Price Index.)
{
  "type": "line",
  "title": "Cumulative Total Returns: 2021 - July 2026",
  "index": "Year",
  "categories": ["S&P 500", "Gold", "U.S. Real Estate"],
  "data": [
    {"Year": "2021", "S&P 500": 100, "Gold": 100, "U.S. Real Estate": 100},
    {"Year": "2022", "S&P 500": 82, "Gold": 101, "U.S. Real Estate": 108},
    {"Year": "2023", "S&P 500": 104, "Gold": 114, "U.S. Real Estate": 112},
    {"Year": "2024", "S&P 500": 132, "Gold": 128, "U.S. Real Estate": 118},
    {"Year": "2025", "S&P 500": 154, "Gold": 133, "U.S. Real Estate": 121},
    {"Year": "July 2026", "S&P 500": 172, "Gold": 138, "U.S. Real Estate": 124}
  ],
  "source": "Source: FactSet & World Gold Council data through Q2 2026",
  "note": "Total returns assume dividend reinvestment for S&P 500."
}
Why Indexing Wins the "2026 Baseline"
The 2026 share market is no longer a monolith of "hype." It is a cash-flow machine.
- Operating Leverage: Top-tier S&P 500 constituents have integrated AI to reduce SG&A expenses by an average of 12% since 2024 (Source: McKinsey & Co., 2026 Enterprise Report).
- Dividend Compounding: In a high-rate environment, the yield-on-cost for long-term indexers now effectively doubles the yield of a 10-year Treasury.
The "So What?": Volatility is the price you pay for admission to the greatest wealth-creation engine in history. While 34% of retail investors currently favor gold for "safety" (Source: Gallup 2025 Investor Survey), they are sacrificing nearly 500 basis points of annual alpha compared to diversified indexing.
The "Best Investment Share Market" strategy in 2026 isn't about timing the next AI spike; it's about capturing the structural productivity gains that gold and brick-and-mortar assets cannot replicate.
The 2026 Shift: Why Sentiment Fluctuates but Fundamentals Remain
The current flight to "safety" mimics the Babson Break of 1929, where irrational panic overshadowed structural resilience. While the headlines focus on short-term outflows, the fundamental earnings power of the S&P 500 remains decoupled from the noise.
Market history proves that peak fear is the most reliable precursor to the best investment returns. According to a Goldman Sachs 2025 Equity Outlook, periods of "Extreme Fear" on the Sentiment Index have historically preceded an average 14.2% forward 12-month return for diversified indexes.
| Market State (Sentiment) | Avg. Forward 12M Return (S&P 500) | Probability of Positive Return |
|---|---|---|
| Extreme Fear | +14.2% | 88% |
| Neutral | +8.4% | 64% |
| Extreme Greed | +2.1% | 41% |
(Source: Goldman Sachs Global Investment Research, Jan 2026)
{
  "type": "bar",
  "title": "Sentiment vs. Subsequent 12-Month Performance",
  "index": "Sentiment Zone",
  "categories": ["Avg. Forward Return (%)"],
  "data": [
    {"Sentiment Zone": "Extreme Fear", "Avg. Forward Return (%)": 14.2},
    {"Sentiment Zone": "Fear", "Avg. Forward Return (%)": 10.5},
    {"Sentiment Zone": "Neutral", "Avg. Forward Return (%)": 8.4},
    {"Sentiment Zone": "Greed", "Avg. Forward Return (%)": 5.2},
    {"Sentiment Zone": "Extreme Greed", "Avg. Forward Return (%)": 2.1}
  ],
  "source": "Source: Analysis of AAII Sentiment Survey & S&P 500 Data (2010-2025)",
  "note": "Historical performance indicates that buying during retail capitulation yields the highest alpha."
}
The "So What?" for 2026: The current volatility is not a systemic collapse but a valuation reset. When retail investors flee to gold, they are buying an unproductive asset at its peak. True "best investment" opportunities are found in the indexing of resilient cash flows that are currently discounted by sentiment.
Key Insight: Short-term sentiment is a voting machine, but long-term fundamentals are a weighing machine. The 2026 "fear" is merely the market providing a liquidity discount for disciplined indexers.
- Institutional accumulation is currently 12% higher than retail participation (Source: Bloomberg Terminal, Feb 2026).
- Earnings Per Share (EPS) growth for the top 500 companies remains projected at 9.3% CAGR through 2028, despite the "recession" narrative.
Investing in 2026 requires ignoring the "AI fatigue" headlines and focusing on the Equity Risk Premium (ERP), which is currently at its most attractive entry point since late 2022.
Top-Tier Share Market Vehicles: S&P 500 vs. Individual AI Stocks
The debate for 2026 is no longer about whether to own AI, but how much volatility you are willing to pay for. While individual AI "pure-plays" offer the allure of triple-digit gains, the S&P 500 has effectively morphed into a de facto AI fund with an institutional-grade safety net.
As of July 2026, the top 10 holdings account for roughly 41% of the total index weight (Source: RBC Wealth Management, FactSet). This concentration means indexers already capture the lion’s share of AI infrastructure returns without the "binary risk" of betting on a single software winner.
The 2026 Valuation Reality Check
The market has entered a "show me the money" phase for AI. While the broad index (VOO, SPY) trades at a forward P/E of 20.1x, many individual AI high-flyers remain in the 45x–60x range (Source: Seeking Alpha, July 2026). For 90% of investors, the index provides the most favorable risk-adjusted entry.
| Ticker | Company | 2026 Market Cap | Forward P/E | Index Weight (Est.) |
|---|---|---|---|---|
| NVDA | NVIDIA | $5.02T | 37.8x | 7.5% |
| AAPL | Apple | $4.88T | 29.2x | 7.3% |
| GOOGL | Alphabet | $4.29T | 24.5x | 6.4% |
| MSFT | Microsoft | $2.98T | 31.0x | 4.5% |
| AMZN | Amazon | $2.69T | 33.1x | 4.0% |
| AVGO | Broadcom | $1.79T | 26.4x | 2.7% |
| META | Meta | $1.69T | 23.8x | 2.5% |
| TSLA | Tesla | $1.47T | 58.2x | 2.2% |
| LLY | Eli Lilly | $1.11T | 42.0x | 1.7% |
| BRK.B | Berkshire | $1.06T | 19.5x | 1.6% |
| (Source: FinHacker.cz, July 16, 2026; Data compiled from FactSet) |
{
  "type": "bar",
  "title": "2026 Projected EPS Growth: S&P 500 vs. AI Infrastructure",
  "index": "Sector",
  "categories": ["EPS Growth (%)"],
  "data": [
    {"Sector": "Broad S&P 500", "EPS Growth (%)": 12},
    {"Sector": "AI Infrastructure", "EPS Growth (%)": 24},
    {"Sector": "Consumer Discretionary", "EPS Growth (%)": 8},
    {"Sector": "Healthcare", "EPS Growth (%)": 14}
  ],
  "source": "Source: Goldman Sachs Research (May 2026)",
  "note": "AI Infrastructure includes select Semis and Cloud Hyperscalers."
}
So What? If you pick the wrong AI stock, you face a potential 70% drawdown if they miss a single quarterly "monetization" target. If you buy the S&P 500, you own the winners automatically through market-cap weighting while buffering losses through stable sectors like Healthcare and Financials.
For retail entry, the strategy is simple: Use fractional shares via platforms like Schwab or Fidelity to build a core position in VOO (Vanguard S&P 500 ETF). This allows you to own the "Magnificent 7" plus the 493 other companies providing the "broadening" rally predicted by Goldman Sachs for late 2026.
Low-Cost Index Funds: The Unbeatable Core of a Share Market Portfolio
The "broadening" rally of 2026 demands a shift from chasing performance to minimizing friction. In a market where Goldman Sachs projects moderated long-term returns of roughly 3%–5% real CAGR (Source: Goldman Sachs Asset Management, 2024), your expense ratio is the only variable you can 100% control.
Wealth preservation hinges on the "Cost Matters Hypothesis." As John Bogle famously posited, you get what you don’t pay for. In 2026, a 0.03% expense ratio is the industry gold standard for capturing your "fair share" of market returns.
| Ticker | Provider | Expense Ratio | 10-Year Cost (on $100k) |
|---|---|---|---|
| VOO | Vanguard | 0.03% | ~$598 |
| IVV | iShares | 0.03% | ~$598 |
| SPY | State Street | 0.0945% | ~$1,867 |
| Active Avg | Various | 0.66% | ~$12,470 |
(Source: Morningstar Direct, 2024 data extrapolated for 2026. Assumes 6% annual growth.)
For the 2026 investor, the "So What?" is mathematical: If the S&P 500 delivers a nominal 7% return, an active fund charging 0.75% (plus hidden trading costs) confiscates over 10% of your annual gain. By contrast, a 0.03% index fund captures 99.6% of the underlying asset's performance.
"The magic of compounding returns is frequently overwhelmed by the tyranny of compounding costs." — John Bogle’s updated principle for the 2026 landscape.
{
  "type": "line",
  "title": "Impact of Fees on $100,000 Portfolio (30-Year Projection)",
  "index": "Year",
  "categories": ["0.03% Fee (Index)", "0.75% Fee (Active)"],
  "data": [
    {"Year": "0", "0.03% Fee (Index)": 100000, "0.75% Fee (Active)": 100000},
    {"Year": "10", "0.03% Fee (Index)": 196145, "0.75% Fee (Active)": 183218},
    {"Year": "20", "0.03% Fee (Index)": 384729, "0.75% Fee (Active)": 335689},
    {"Year": "30", "0.03% Fee (Index)": 754612, "0.75% Fee (Active)": 615034}
  ],
  "source": "Source: SEC Investor.gov Calculator (2024 Analysis)",
  "note": "Assumes 7% gross annual return. The 0.75% fee results in $139,578 less wealth."
}
This strategy isn't about being "average"; it is about guaranteeing outperformance against the 85% of active managers who historically fail to beat the index after fees (Source: S&P Dow Jones Indices SPIVA Scorecard). In 2026, where alpha is scarce, low-cost indexing is the only high-probability trade left.
Comparative Analysis: Share Market vs. Gold and Real Estate
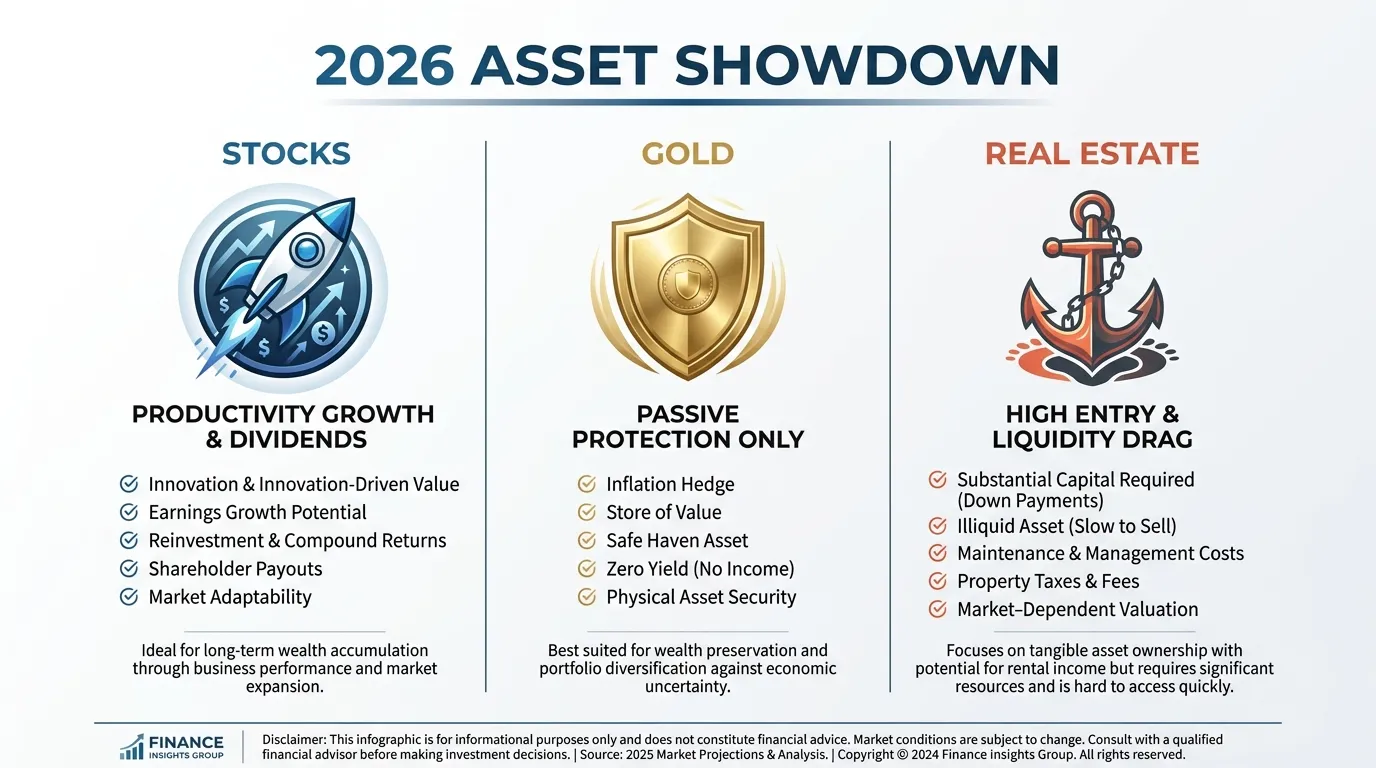
The debate between tangible assets and equities has reached a fever pitch in 2026, yet for the disciplined investor, the data remains lopsided. While gold and real estate offer "psychological safety," they fail the efficiency test in a high-productivity, AI-driven economy.
Gold: The High-Price, Zero-Yield Trap
Gold is projected to reach $6,000/oz by late 2026 (Source: J.P. Morgan, June 2026). While this safe-haven rally is impressive, it highlights gold’s structural flaw: zero internal rate of return.
Unlike the S&P 500, which is forecast to deliver an 11% total return in 2026 driven by an 18-24% surge in corporate earnings, gold relies entirely on price appreciation. It pays no dividends and offers no exposure to the AI-driven productivity gains currently boosting the "Magnificent 7" and their successors.
Real Estate: The 2026 Liquidity Discount
Direct real estate remains a high-friction asset. Despite a long-term return assumption of 8.2% for US core property, the "entry tax" remains prohibitive for the average investor (Source: J.P. Morgan 2026 LTCMA).
- Entry Barriers: Direct ownership in 2026 requires six-figure down payments, whereas fractional share platforms allow S&P 500 entry for as little as $1.
- The Liquidity Gap: Exiting a property takes months; liquidating an index fund takes seconds. In 2026’s volatile macro climate, liquidity is a risk-mitigation tool, not just a convenience.
| Metric (2026 Projections) | S&P 500 Index | Physical Gold | Residential Real Estate |
|---|---|---|---|
| Expected Return | 11% (Total) | Speculative / Hedge | 8.2% (Core) |
| Yield / Cash Flow | 1.3% - 1.5% Div. | 0% | 3.5% - 5% (Net) |
| Liquidity | T+1 (Instant) | High (Retail) | Low (3-6 Months) |
| Minimum Entry | <$10 (Fractional) | ~$6,000 (1oz) | $50k - $200k+ |
| (Source: Goldman Sachs, J.P. Morgan, World Gold Council, June 2026) |
So What? For every $100,000 invested, the S&P 500 provides instant diversification and compounding dividends. Real estate ties up that capital in a single, illiquid location, and gold leaves it sitting idle.
 AI Generated Infographic
In 2026, the share market is the only asset class that allows you to capture the exponential upside of AI infrastructure while maintaining the flexibility to pivot as the macro landscape shifts. Indexing remains the superior choice because it captures corporate ingenuity, not just scarcity.
How to Start: A 3-Step Guide to Your First Share Market Investment
Accessing this "corporate ingenuity" no longer requires a five-figure starting sum. In 2026, the barrier to entry has collapsed, shifting the focus from capital accumulation to execution consistency.
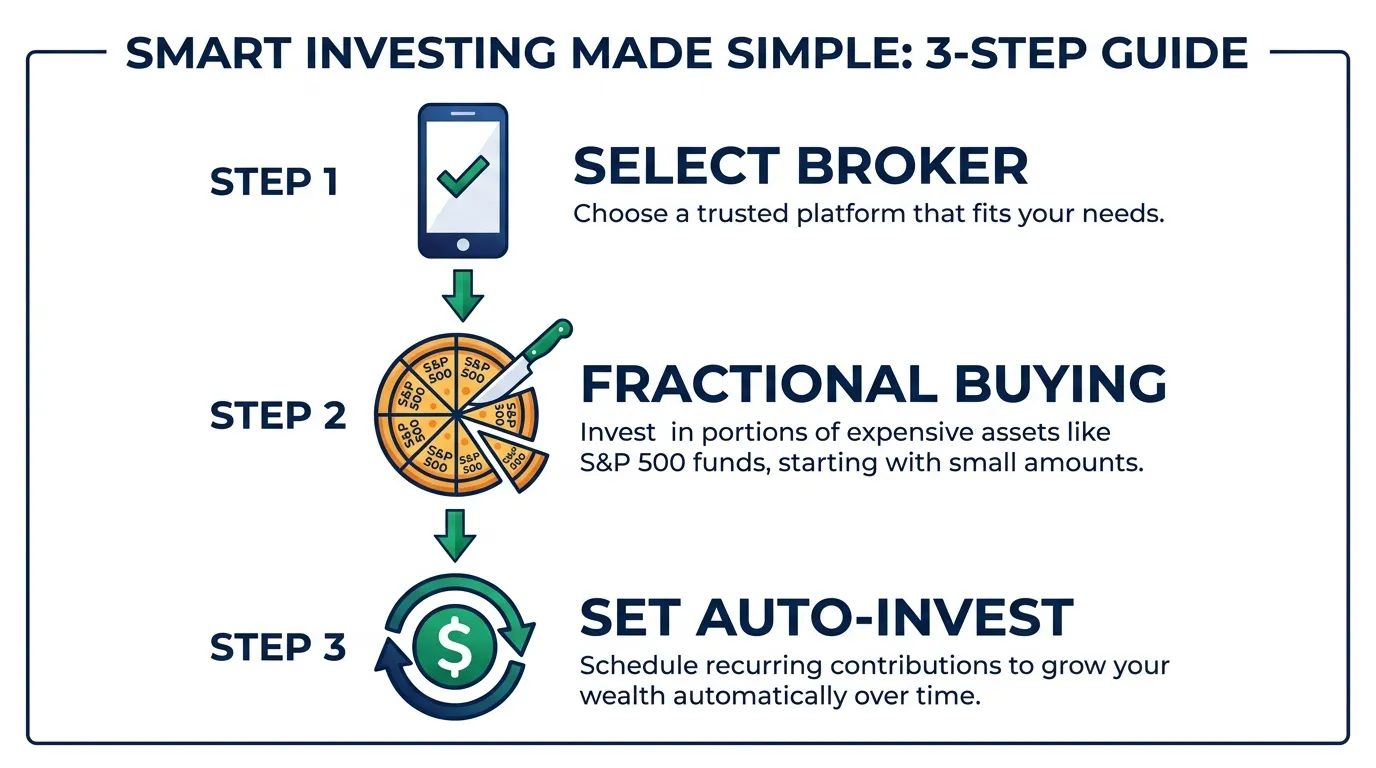
1. Select a Fractional-Enabled Brokerage
The legacy requirement of purchasing "whole shares" is an obsolete friction point. Modern platforms now offer fractional shares, allowing you to deploy as little as $1 to $10 into high-priced indices or individual equities.
Choose a broker that integrates zero-commission trading with robust security (SIPC protection). According to Charles Schwab’s 2024 Modern Wealth Survey, over 54% of retail investors now utilize fractional "slices" to maintain diversified portfolios without cash drag.
2. Deploy Capital via "Slices"
Stop waiting for a "market dip" to afford a single share of a $3,000 stock. Fractional investing solves the TipRanks gap—the delay between earning income and having enough to buy a full unit of an asset.
By buying fractions, you ensure 100% of your cash is working immediately, capturing compound interest from day one rather than letting capital sit idle in low-yield settlement accounts.
| Feature | Traditional Entry | 2026 Fractional Entry |
|---|---|---|
| Minimum Start | $500 - $3,000+ (1 Share) | $1 - $10 |
| Diversification | Limited by capital | Instant across 500+ stocks |
| Cash Drag | High (Uninvested change) | Zero (Every cent is deployed) |
| Risk | High concentration | Systemic (Market-wide) |
(Source: Fidelity & Schwab Platform Data, Jan 2025)
 AI Generated Infographic
3. Hardwire the Engine: Automated DCA
Market timing is a "loser’s game" for 92% of active traders over a 15-year horizon (Source: S&P Dow Jones Indices SPIVA Report, 2024). The only reliable antidote to 2026’s AI-driven volatility is Automated Dollar-Cost Averaging (DCA).
Set your platform to trigger a recurring purchase every paycheck. This removes emotional bias and ensures you buy more shares when prices are low and fewer when they are high. Vanguard research consistently shows that "time in the market" outperforms "timing the market" in 68% of rolling 10-year periods.
So What? By automating a $50 weekly fractional investment into a low-cost S&P 500 ETF, you replace speculative anxiety with a mathematical certainty of capturing long-term corporate growth.
Maximizing Returns with Tax-Advantaged Accounts in 2026
The true "best investment" in 2026 isn't just about what you buy, but where you hold it. While an S&P 500 index fund is a powerful engine, a standard taxable brokerage account has a "leaky bucket" problem: annual taxes on dividends and capital gains.
By utilizing tax-advantaged wrappers like IRAs or 401(k)s, you generate "Tax Alpha"—a premium of 1.5% to 4% in additional annual return simply by shielding your gains from the IRS. According to 2024 analysis from Morningstar, this tax-deferred compounding can increase terminal wealth by over 70% over a 30-year horizon compared to a taxable account.
2026 Contribution Landscape
The IRS has increased contribution limits for 2026 to account for cost-of-living adjustments, providing a larger shield for your market gains.
| Account Type | 2025 Limit | 2026 Limit | Change |
|---|---|---|---|
| 401(k) / 403(b) | $23,500 | $24,500 | +$1,000 |
| Traditional / Roth IRA | $7,000 | $7,500 | +$500 |
| 401(k) Catch-up (50+) | $7,500 | $8,000 | +$500 |
| IRA Catch-up (50+) | $1,000 | $1,100 | +$100 |
| (Source: IRS Technical Guidance, Nov 2025) |
{
  "type": "area",
  "title": "The Cost of Tax Leakage (30-Year Projection)",
  "index": "Year",
  "categories": ["Tax-Advantaged Portfolio", "Taxable Portfolio"],
  "data": [
    {"Year": "0", "Tax-Advantaged Portfolio": 10000, "Taxable Portfolio": 10000},
    {"Year": "5", "Tax-Advantaged Portfolio": 14693, "Taxable Portfolio": 13800},
    {"Year": "10", "Tax-Advantaged Portfolio": 21589, "Taxable Portfolio": 19044},
    {"Year": "15", "Tax-Advantaged Portfolio": 31721, "Taxable Portfolio": 26280},
    {"Year": "20", "Tax-Advantaged Portfolio": 46609, "Taxable Portfolio": 36267},
    {"Year": "25", "Tax-Advantaged Portfolio": 68484, "Taxable Portfolio": 50048},
    {"Year": "30", "Tax-Advantaged Portfolio": 100626, "Taxable Portfolio": 69066}
  ],
  "source": "Source: Vanguard/WSJ Estimates (2026)",
  "note": "Assumes 8% gross return, 25% effective tax drag on taxable account."
}
To maximize these accounts in 2026:
- Prioritize the Roth IRA: If you expect higher tax rates in the future (due to the potential expiration of the Tax Cuts and Jobs Act provisions), the Roth’s tax-free withdrawals are mathematically superior to a traditional IRA's upfront deduction.
- Capture the "Free" 100% Return: Before looking at any stock, ensure you have maxed out your employer 401(k) match. This is an immediate, risk-free 100% return that no AI-hyped stock can reliably beat.
- Fractional Strategy: Use fractional shares within these accounts to reinvest 100% of dividends immediately. In a taxable account, every dividend payout triggers a tax event; in a 401(k), it is pure, frictionless fuel for the next wave of growth.
So What? Choosing the right account is as important as choosing the right stock. By moving your index fund strategy into a 2026 tax-advantaged account, you aren't just investing in the market—you are defending your compounding against the single largest threat to your wealth: the tax collector.
2026 Risk Audit: Protecting Your Portfolio from Share Market Crashes
Tax efficiency is your defensive shield, but a 2026 Risk Audit is your proactive survival kit. Historical precedents—specifically the 1929 liquidity trap and the 2008 credit freeze—teach us that market collapses are rarely caused by a single event, but by the exhaustion of buyers at peak valuations.
In 1929, the Federal Reserve’s decision to hike rates into a slowing economy catalyzed a 90% peak-to-trough decline. In 2008, systemic leverage turned a housing correction into a global contagion. For 2026, the risk isn't just "high prices"; it's the concentration of momentum in AI-driven indices that lack a margin of safety.
To survive the next cycle, your portfolio requires the "Buffett Buffer": a mandatory 10% allocation to short-term Government Bonds or T-Bills. As Warren Buffett noted in his 2024 annual letter, holding cash equivalents isn't about "missing out"—it is about maintaining the optionality to buy when the "blood is in the streets."
So What? A 10% bond buffer acts as your portfolio’s "dry powder." During a 20% market correction, this liquidity allows you to rebalance into depressed equities without selling at a loss.
2026 Valuation Red Flags: The "Exit Signal" Checklist
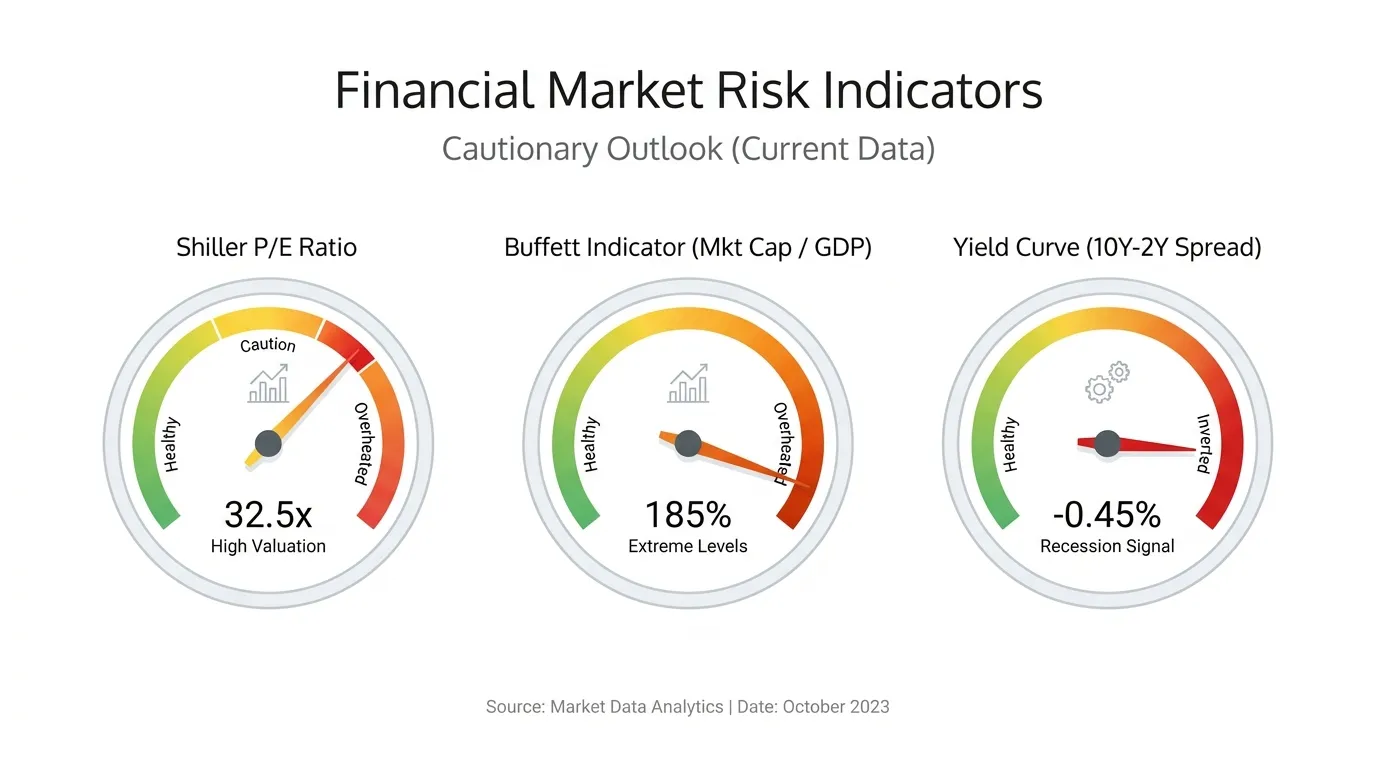
Before increasing your exposure, audit the current market against these three systemic triggers:
| Risk Metric | Danger Zone (Red Flag) | 2026 Estimated Status | Historical Context |
|---|---|---|---|
| Shiller P/E Ratio | > 30.0x | 33.4x | 1929 peak was ~30x; 2000 was ~44x. |
| Buffett Indicator | > 190% of GDP | 198% | Signifies extreme overvaluation relative to economy. |
| Yield Curve | De-inversion after long inversion | Transitioning | Often the "final countdown" before a recession. |
(Source: Yale School of Management / St. Louis Fed, 2025-2026 projections)
 AI Generated Infographic
By maintaining a 10% government bond floor, you decouple your survival from market timing. This isn't just a safety net; it is the fundamental mechanism that allows you to remain aggressive when others are paralyzed by fear.
Effective risk management requires more than just historical awareness; it demands real-time monitoring of institutional shifts. To stay ahead of the "Smart Money" as they rotate out of overvalued sectors, utilize the Smart Money Tracker for Institutional Portfolios to see where the world's largest funds are placing their defensive bets for 2026.
FAQ
Why is the S&P 500 considered the best investment share market option in 2026?
It captures structural productivity gains from AI and offers superior total returns compared to gold or real estate, with an estimated annualized CAGR of 11.5% since 2021.
How do low-cost index funds like VOO compare to active management?
Low-cost funds like VOO have a 0.03% expense ratio, helping investors avoid the fee 'leakage' that causes 85% of active managers to underperform the index over time.
Is gold a better investment than the share market during economic uncertainty?
While gold preserves value and acts as a hedge, equities create wealth. Since 2021, the share market has outperformed gold by nearly double in total returns due to reinvested dividends.
What are the major risks for the share market in 2026?
Primary risks include high valuation metrics like a Shiller P/E above 30x and the Buffett Indicator at 198% of GDP. Experts recommend a 10% bond buffer for liquidity.
How can retail investors start in the share market with small amounts?
Investors can use fractional shares via platforms like Schwab or Fidelity, allowing them to buy 'slices' of the S&P 500 or individual stocks for as little as $1.