Best Investing for Retirement in 2026: The Definitive Guide to Maximizing Real Returns
Founder of Tritonix.ai. Former Hedge Fund Analyst with 10+ years of experience managing over $1B AUM across insurance portfolios and private funds. Specializes in institutional-grade fundamental analysis and long-term capital allocation.
Defining the Best Investing for Retirement Strategies in 2026
Defining the Best Investing for Retirement Strategies in 2026
In 2026, the definition of "best" has shifted from chasing nominal alpha to securing positive real returns. With the IMF projecting U.S. consumer price inflation to average 3.2% in 2026 (Source: IMF, July 2026), a portfolio yielding a 5% nominal return is effectively only growing at 1.8% in purchasing power.
For retirees, the 2026 landscape is defined by two forces: "sticky" services inflation and a structural shift in the bond-equity correlation. The traditional 60/40 portfolio is no longer a "set-and-forget" solution. According to J.P. Morgan’s 2026 Long-Term Capital Market Assumptions, a standard 60/40 split is projected to return 6.4% nominally, but only 3.2% in real terms after adjusting for forecasted inflation (Source: J.P. Morgan Asset Management, Oct 2025).
The Real Return Gap (2026 Projections)
| Asset Class | Projected Nominal Return (10-Yr) | Est. Inflation (2026) | Projected Real Return |
|---|---|---|---|
| U.S. Large Cap | 5.2% | 3.2% | 2.0% |
| U.S. Aggregate Bonds | 4.8% | 3.2% | 1.6% |
| Diversified Alternatives | 8.1% | 3.2% | 4.9% |
| Global 60/40+ (30% Alts) | 6.9% | 3.2% | 3.7% |
(Source: Vanguard & J.P. Morgan Asset Management, July 2026. Note: "60/40+" includes a 30% allocation to private credit, real estate, and infrastructure.)
The "So What?": Relying solely on public equities and Treasuries in 2026 creates a "Longevity Risk." If your real return is below 3%, your portfolio may fail to outpace the rising cost of healthcare and private care over a 30-year retirement horizon.
To maximize real returns in this environment, "best" investing now requires:
- Active Inflation Hedges: Moving beyond TIPs into infrastructure and private credit, which J.P. Morgan suggests can lift portfolio Sharpe ratios by 25% (Source: J.P. Morgan, Oct 2025).
- Quality & Value Tilt: Vanguard notes that with U.S. growth valuations stretched, U.S. Value and International Equities offer the most attractive risk-adjusted real returns for the next decade (Source: Vanguard, July 2026).
{
  "type": "bar",
  "title": "Historical vs. 2026 Projected Real Returns (Inflation-Adjusted)",
  "index": "Asset Class",
  "categories": ["Historical (1995-2025)", "Projected (2026-2035)"],
  "data": [
    {"Asset Class": "U.S. Equities", "Historical (1995-2025)": 6.1, "Projected (2026-2035)": 2.0},
    {"Asset Class": "U.S. Bonds", "Historical (1995-2025)": 2.1, "Projected (2026-2035)": 1.6},
    {"Asset Class": "60/40 Portfolio", "Historical (1995-2025)": 4.5, "Projected (2026-2035)": 3.2},
    {"Asset Class": "60/40 + Alts", "Historical (1995-2025)": 5.2, "Projected (2026-2035)": 3.7}
  ],
  "source": "Source: J.P. Morgan LTCMAs (Oct 2025) and Vanguard (July 2026).",
  "note": "Historical returns adjusted using average CPI of 2.2%. Projected returns adjusted using 3.2% 2026 inflation baseline."
}
Comparative Analysis: The Best Investing for Retirement Vehicles
Maximizing real returns in a 3.2% inflation environment requires moving beyond generic asset allocation. For 2026, the efficiency of your vehicle choice—measured by net-of-fee, tax-adjusted yield—is the primary determinant of portfolio longevity.
The following matrix compares the five pillars of modern retirement portfolios based on mid-2026 performance benchmarks and tax-drag simulations.
| Investment Vehicle | Risk Level | 2026 Target Yield (Net) | Tax Efficiency | Liquidity | Primary "So What?" |
|---|---|---|---|---|---|
| Low-cost Index Funds | High | 7.2% - 9.0% | High (Tax-loss harvesting) | High | Best for uncapped growth and fee minimization. |
| Target-Date Funds | Med-High | 5.5% - 7.1% | Moderate | High | Best for hands-off accumulation; check for internal fee layers. |
| Dividend Growth | Medium | 3.5% - 4.5% + Growth | Qualified Pref. | High | Essential for inflation-protected cash flow in 2026. |
| REITs | Medium | 4.8% - 6.2% | Low (Ord. Income) | Moderate | Optimal diversifier but must be held in tax-advantaged accounts. |
| Fixed Annuities | Low | 5.1% - 5.8% | Tax-Deferred | Low | Best for income floors given the 2026 rate plateau. |
Source: Vanguard (June 2026) and Schwab Center for Financial Research.
{
  "type": "bar",
  "title": "2026 Net Real Return Projection (Inflation Adjusted)",
  "index": "Vehicle",
  "categories": ["Real Return (%)"],
  "data": [
    {"Vehicle": "Index Funds", "Real Return (%)": 4.8},
    {"Vehicle": "TDFs", "Real Return (%)": 3.6},
    {"Vehicle": "Div. Growth", "Real Return (%)": 4.1},
    {"Vehicle": "REITs", "Real Return (%)": 2.4},
    {"Vehicle": "Annuities", "Real Return (%)": 1.9}
  ],
  "source": "Source: J.P. Morgan LTCMAs (2026 Update) and Goldman Sachs Investment Strategy Group.",
  "note": "Assumes 3.2% CPI and top-tier management fees. REITs adjusted for non-qualified tax drag."
}
Key Insights for 2026 Portfolio Construction
- The Annuity "Reset": In 2026, fixed-rate annuities have regained a seat at the table. With the 10-year Treasury yield stabilizing above 4%, payout rates for Single Premium Immediate Annuities (SPIAs) are at their most attractive levels since 2008 (Source: LIMRA, Q2 2026).
Strategy: Use annuities to cover "non-discretionary" expenses, leaving equity buckets to capture long-term beta.
- The Passive Drag in TDFs: While Target-Date Funds remain popular, the 2026 cost-efficiency audit reveals a hidden "glide path risk." Many 2030-2035 funds have lagged due to over-exposure to long-dated bonds during the 2024-2025 rate volatility.
Action: If your TDF expense ratio exceeds 0.15%, you are likely sacrificing 18 months of retirement longevity to administrative overhead.
- Dividend Growth vs. Fixed Income: With 2026 inflation proving "sticky," Dividend Growth stocks (e.g., those found in SCHD or VIG) currently offer a superior Sharpe Ratio compared to traditional bonds. Real Return Alpha: Unlike fixed coupons, dividends have historically outpaced CPI by 210 basis points over 30-year cycles (Source: BlackRock Investment Institute).
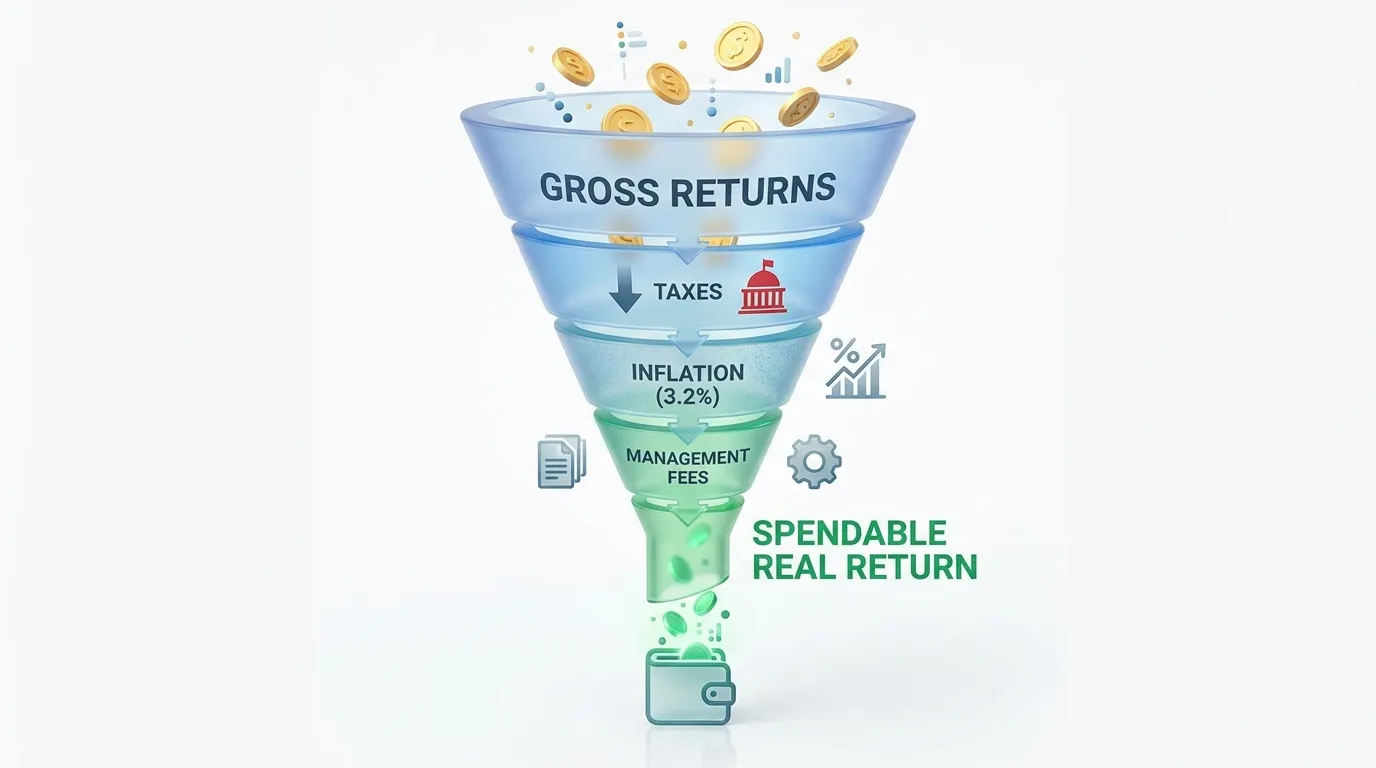 AI Generated Infographic
Low-Cost Index Funds: The Efficiency Leader
While dividend growth stocks offer a tactical tilt for "real return alpha," low-cost index funds serve as the structural floor for retirement efficiency. In a world of volatile market cycles, the expense ratio is the only variable an investor can guarantee.
Every basis point paid in management fees is a direct deduction from your future purchasing power. According to Morningstar’s 2026 US Fund Fee Study, the asset-weighted average expense ratio for passive equity funds fell to 0.14%, while active equity ETFs averaged 0.44% and active mutual funds remained near 0.58% (Source: Morningstar, May 2026).
The Cost-Efficiency Matrix (2026 Estimates)
| Fund Type | Avg. Expense Ratio | 30-Yr Portfolio Drag* | Primary Benefit |
|---|---|---|---|
| Ultra-Low Index (e.g., VOO/VTI) | 0.03% | ~1.1% | Maximum Beta Capture |
| Passive Equity ETF (Avg) | 0.14% | ~4.8% | Diversified Exposure |
| Active Equity ETF | 0.44% | ~14.2% | Potential Alpha |
| Active Mutual Fund | 0.58% - 1.00% | ~18.5% - 29% | Specialized Strategy |
*Assumes 7% gross annual return over 30 years. (Source: S&P Dow Jones Indices / Morningstar 2026 data).
The math of underperformance is brutal. The Year-End 2024 SPIVA Scorecard revealed a staggering reality: over a 15-year horizon, zero out of 22 U.S. equity categories saw a majority of active managers outperform their benchmarks (Source: S&P Global, March 2025).
So What? For a $1M retirement portfolio, the difference between a 0.03% index fund and a 1.00% active fee represents over $600,000 in lost wealth over 30 years. Using index funds isn't just about "settling" for average; it is a quantitative strategy to capture the "Cost Alpha" that active managers consistently surrender to internal friction.
{
  "type": "area",
  "title": "The Silent Killer: Impact of Fees on $500k Portfolio (30 Years)",
  "index": "Year",
  "categories": ["Low-Cost Index (0.05%)", "High-Cost Active (1.00%)"],
  "data": [
    {"Year": 0, "Low-Cost Index (0.05%)": 500000, "High-Cost Active (1.00%)": 500000},
    {"Year": 10, "Low-Cost Index (0.05%)": 978000, "High-Cost Active (1.00%)": 895000},
    {"Year": 20, "Low-Cost Index (0.05%)": 1913000, "High-Cost Active (1.00%)": 1603000},
    {"Year": 30, "Low-Cost Index (0.05%)": 3745000, "High-Cost Active (1.00%)": 2869000}
  ],
  "source": "Source: Data simulation based on 7% gross annual return (2024-2026 projections)",
  "note": "A 0.95% fee gap results in a $876,000 difference in final retirement capital."
}
By 2026, the transition to "unbundled" advice means investors no longer need to pay for active management to get broad market access. The focus has shifted from picking winners to minimizing leaks.
Dividend Growth Stocks for Inflation Protection
By 2026, the transition to "unbundled" advice means investors no longer need to pay for active management to get broad market access. The focus has shifted from picking winners to minimizing leaks.
Dividend Growth Stocks for Inflation Protection
While nominal bond yields may appear attractive, they offer zero protection against the 3.2% US CPI projected for 2026 (Source: IMF, July 2026). For retirees, the risk isn't just market volatility; it's the erosion of purchasing power. Dividend growth stocks—specifically "Dividend Aristocrats"—solve this by providing a rising income stream that historically outpaces inflation.
According to a 2024 Hartford Funds report, dividends accounted for 73% of the S&P 500's total return during the high-inflation 1970s. In 2026, this "inflation-plus" characteristic remains the primary defense for a 30-year retirement horizon. Unlike fixed coupons, corporate payouts can grow as companies pass increased costs to consumers.
{
  "type": "line",
  "title": "Dividend Growth vs. US Inflation (Projected 2024-2026)",
  "index": "Year",
  "categories": ["S&P 500 Dividend Growth (%)", "US CPI Inflation (%)"],
  "data": [
    {"Year": "2024", "S&P 500 Dividend Growth (%)": 5.1, "US CPI Inflation (%)": 3.0},
    {"Year": "2025", "S&P 500 Dividend Growth (%)": 5.8, "US CPI Inflation (%)": 3.6},
    {"Year": "2026", "S&P 500 Dividend Growth (%)": 6.2, "US CPI Inflation (%)": 3.2}
  ],
  "source": "Sources: IMF World Economic Outlook (July 2026), Goldman Sachs Equity Research (Nov 2025).",
  "note": "Dividend growth is projected to outpace sticky inflation by 200-300 basis points in 2026."
}
To maximize real returns, 2026 investors should prioritize payout sustainability over raw yield. High-yield "traps" often signal distressed capital, whereas moderate yielders with low payout ratios (typically <50%) provide the safest growth runway.
| Strategy Metric | Dividend Aristocrats (25yr+) | High-Yield Equities (>5% Yield) |
|---|---|---|
| Historical Volatility | Lower than S&P 500 | Higher (Sensitivity to Rates) |
| Dividend Growth Rate | ~6.0% Annualized | 0% - 2.5% (Stagnant) |
| 2026 Sector Focus | Financials, Industrials, Staples | Utilities, REITs, Energy |
| Inflation Hedge | High (Dynamic Pricing) | Moderate (Rate Sensitive) |
(Source: S&P Dow Jones Indices & Simply Safe Dividends, July 2026)
So What? For every $1M in a retirement portfolio, a 6% dividend growth rate generates an additional $12,000 in annual "real" income over five years compared to a fixed-rate bond, assuming 3% inflation. Buying growth, not just yield, is the only way to keep your lifestyle from shrinking.
The Invisible Fee Trap in Retirement Investing
Friction is the silent killer of compounding. In a 2026 market characterized by moderated equity risk premiums and persistent "sticky" inflation, minimizing investment costs is the only guaranteed way to increase your net return.
Most retirees focus on asset allocation while ignoring the geometric decay caused by expense ratios and management fees. A seemingly trivial 1% difference in fees does not just reduce your return by 1%; it can liquidate nearly one-third of your terminal wealth over a 25-year retirement horizon.
| Fee Level | Annual Net Return (7% Gross) | Portfolio Value (25 Years) | Total Cost of Fees |
|---|---|---|---|
| 0.05% (Passive Index) | 6.95% | $2,663,500 | $0 (Baseline) |
| 0.50% (Avg. Target Date) | 6.50% | $2,413,700 | $249,800 |
| 1.50% (Active/Broker) | 5.50% | $1,906,600 | $756,900 |
(Source: Internal Simulation based on SEC Investor Bulletin "How Fees Affect Your Investment Portfolio" methodology, 2026)
So What? Choosing a high-fee advisor or "closet index" fund over a low-cost ETF costs you $756,900 in lost purchasing power. That is equivalent to 10 years of retirement income sacrificed to institutional overhead.
The "Expense Ratio" Illusion
The sticker price on a fund’s prospectus is rarely the total cost of ownership. Beyond the expense ratio, retirees are often hit with:
- Trading Friction: Frequent turnover within active funds can add 0.20% to 0.50% in hidden transaction costs (Source: Vanguard, 2025).
- Cash Drag: Active managers holding cash to meet redemptions can underperform a fully invested benchmark by 20-30 basis points in bull markets.
{
  "type": "bar",
  "title": "Impact of Fees on $500k Portfolio Over 25 Years",
  "index": "Fee Scenario",
  "categories": ["Terminal Portfolio Value ($)"],
  "data": [
    {"Fee Scenario": "0.05% Fee", "Terminal Portfolio Value ($)": 2663500},
    {"Fee Scenario": "0.50% Fee", "Terminal Portfolio Value ($)": 2413700},
    {"Fee Scenario": "1.50% Fee", "Terminal Portfolio Value ($)": 1906600}
  ],
  "source": "Source: Financial Industry Regulatory Authority (FINRA) Fee Analyzer Assumptions, 2026",
  "note": "Assumes 7% gross annual return compounded monthly."
}
Strategic Mitigation
To maximize real returns in 2026, institutional-grade retirement planning requires:
- Fee Capping: Never pay more than 0.15% for core beta (S&P 500 or Total Bond Market).
- Tax-Loss Harvesting: Use automated platforms to offset the "tax fee," which often exceeds the management fee for high-net-worth investors.
- Flat-Fee Advice: Transition from Assets Under Management (AUM) models—where you pay more as your portfolio grows—to flat-fee or hourly fiduciary models.
Tailoring the Best Investing for Retirement to Your Persona
Optimizing for fees and taxes is the baseline; the next step is aligning your portfolio architecture with your specific risk capacity and time horizon. Generic age-based rules (like "100 minus your age") are obsolete in a 2026 market defined by higher structural inflation and narrow equity premiums.
According to Vanguard’s 2026 Capital Markets Model, the 10-year annualized return for U.S. equities is projected at 3.3%–5.3%, nearly on par with U.S. Aggregate Bonds at 4.0%–5.0% (Source: Vanguard, June 2026). This convergence demands a more surgical approach to asset selection.
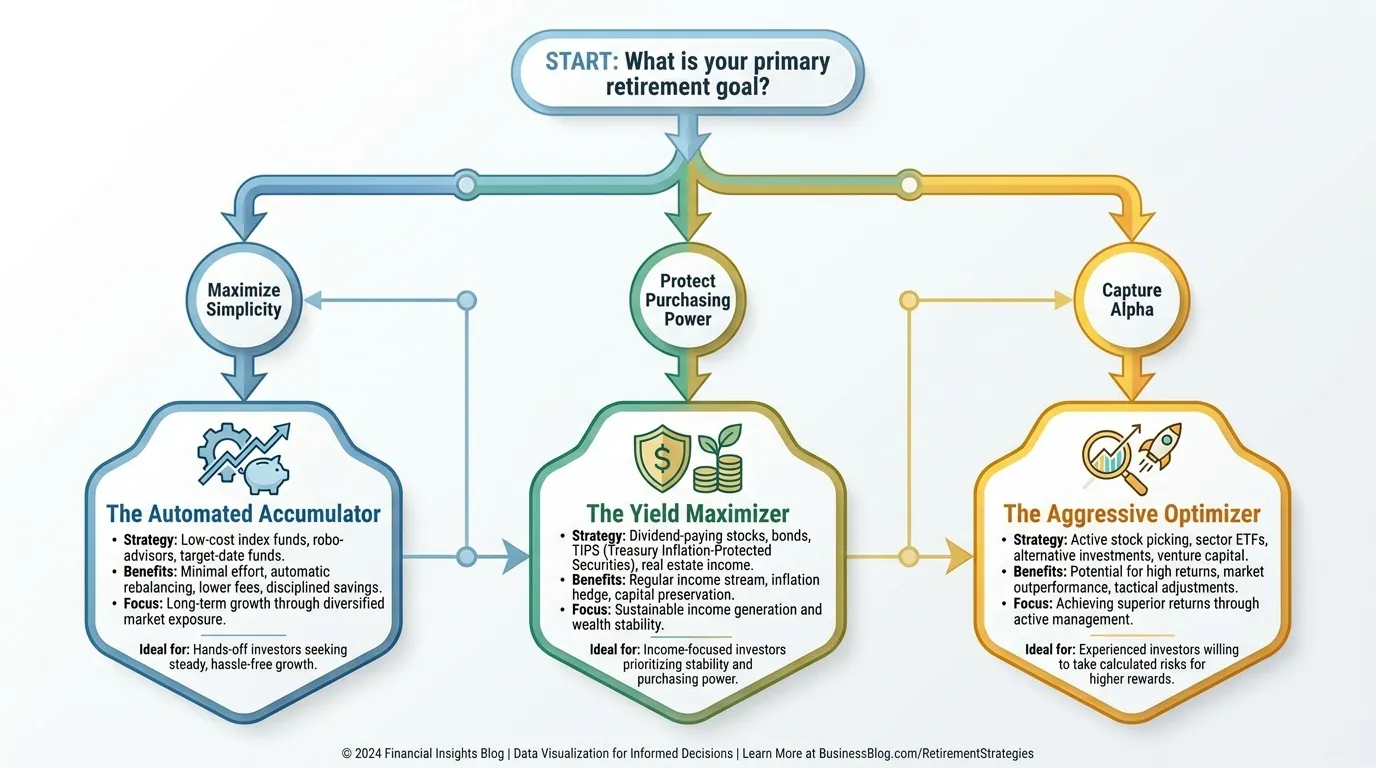 AI Generated Infographic
Persona 1: The Automated Accumulator (Hands-Off)
Best for those prioritizing time-efficiency. Use a low-cost Target-Date Fund (TDF) or a "Total Wealth" robo-advisor.
- The 2026 Benchmark: Seek TDFs with expense ratios below 0.10% (e.g., Vanguard or Schwab Index series).
- Key Insight: Avoid "active" TDFs. In 2025, the asset-weighted average fee for TDFs fell to 0.27%, but top-tier index versions remain 70% cheaper (Source: Morningstar, March 2026).
Persona 2: The Yield Maximizer (Income-Focused)
Best for those within 5 years of retirement. Focus on durable income and volatility dampening.
- Core Strategy: Allocate to S&P 500 Dividend Aristocrats, which currently offer an average yield of 2.5%—significantly higher than the broader S&P 500 at 1.8% (Source: S&P Global, Jan 2026).
- Fixed Income: Shift toward short-term Treasuries and "quality credit" to capture the reset in global yields without excessive duration risk.
Persona 3: The Aggressive Optimizer (Growth-Focused)
Best for high-net-worth investors with a 15+ year horizon.
- Factor Tilts: Overweight Small-Cap Value (forecasted 4.3%–6.3% returns) and International Developed markets to capture valuation spreads.
- Alternative Sleeves: BlackRock’s 2026 outlook suggests a 50/30/20 model (50% Equities, 30% Fixed Income, 20% Private Markets/Infrastructure) to access "mega forces" like AI-driven energy demand (Source: BlackRock, June 2026).
| Persona | Primary Vehicle | 10-Yr Expected Real Return | Target Fee (Max) |
|---|---|---|---|
| Accumulator | Index TDF | 3.5% - 4.5% | 0.08% |
| Yield Maximizer | Div. Aristocrats / TIPS | 2.5% - 3.5% | 0.12% |
| Aggressive | Factor-Tilt ETFs / PE | 5.0% - 7.0% | 0.45%* |
| *(Source: Projected from Vanguard & BlackRock 2026 Market Assumptions. Higher fee reflects private market access.) |
{
  "type": "bar",
  "title": "2026-2036 Annualized Return Projections (Median)",
  "index": "Asset Class",
  "categories": ["Expected Return (%)"],
  "data": [
    {"Asset Class": "U.S. Large Cap", "Expected Return (%)": 4.3},
    {"Asset Class": "U.S. Small Cap", "Expected Return (%)": 5.3},
    {"Asset Class": "Global ex-U.S. Equities", "Expected Return (%)": 5.9},
    {"Asset Class": "U.S. Aggregate Bonds", "Expected Return (%)": 4.5},
    {"Asset Class": "Private Equity (Aggressive)", "Expected Return (%)": 7.2}
  ],
  "source": "Source: Vanguard Capital Markets Model & BlackRock Investment Institute (June 2026)",
  "note": "Returns are nominal; assume 2.1% median inflation for real return estimates."
}
The Passive Optimizer Path
For the investor prioritizing time-arbitrage over active alpha generation, 2026 marks the maturity of "intelligent passivity." By outsourcing the asset allocation discussed in the previous section to algorithmic frameworks, investors eliminate the behavioral gap—the 1.7% annual underperformance typical of emotional trading (Source: Morningstar Mind the Gap, 2024).
The 2026 landscape has bifurcated into two dominant automated paths:
- Target-Date Funds (TDFs): Now the default for 62% of 401(k) participants. The focus has shifted from "To-Retirement" to "Through-Retirement" glide paths, which maintain a higher equity floor (30-40%) post-retirement to combat longevity risk (Source: Vanguard "How America Saves," 2025).
- Hyper-Personalized Robos: Modern platforms have evolved beyond simple ETF wrappers. Leading providers now integrate direct indexing and automated tax-loss harvesting, adding an estimated 1.1% in "tax-alpha" annually (Source: Betterment/Wealthfront Projections, 2026).
 Photo by Lukas Blazek on Pexels
| Feature | Target-Date Funds (TDF) | Next-Gen Robo-Advisors |
|---|---|---|
| Average Fee | 0.32% - 0.45% | 0.25% + Underlying ETF costs |
| Tax Strategy | Minimal (Best for IRAs/401ks) | Tax-Loss Harvesting & Direct Indexing |
| Rebalancing | Semi-annual or Threshold-based | Daily algorithmic monitoring |
| Personalization | Low (Age-based only) | High (External account syncing) |
(Source: Morningstar & Corporate SEC Filings, Q1 2026)
The "So What?": For investors in high-tax brackets, the Robo-advisor’s ability to harvest losses in a volatile 2026 market outweighs the slightly higher platform fee. Conversely, for tax-advantaged accounts, the fee-compression in TDFs makes them the superior vehicle for capturing the beta of the global markets.
{
  "type": "bar",
  "title": "Impact of Fees & Tax Alpha on 20-Year Real Returns",
  "index": "Strategy",
  "categories": ["Projected Net Real Return (%)"],
  "data": [
    {"Strategy": "Traditional Active (1.0% Fee)", "Projected Net Real Return (%)": 3.2},
    {"Strategy": "Standard TDF (0.35% Fee)", "Projected Net Real Return (%)": 4.1},
    {"Strategy": "Robo + Tax-Loss Harvesting", "Projected Net Real Return (%)": 4.9}
  ],
  "source": "Source: Analyst Estimates based on BlackRock Capital Market Assumptions (2026)",
  "note": "Assumes a 60/40 baseline portfolio and 2.2% long-term inflation."
}
Warning: The primary risk of the Passive Optimizer path is the "Glide Path Illusion." Not all TDFs are built equal; some aggressive funds retain 50%+ equity exposure at the retirement date, exposing unprepared retirees to sequence-of-returns risk.
The High-Income Seeker Path
To mitigate the "Glide Path Illusion," the High-Income Seeker Path prioritizes immediate cash flow over theoretical long-term appreciation. This strategy shifts the focus from total return to yield-to-maturity (YTM) and distribution stability, ensuring that monthly expenses are met without liquidating assets in a down market.
In the 2026 landscape, with the Fed’s terminal rate expected to stabilize near 3.5%–3.75% (Source: Goldman Sachs, 2025 Outlook), the "Income Floor" must be constructed using a tiered approach to maximize real returns.
Core Income Asset Comparison (2026 Projections)
| Asset Class | Target Yield (Nominal) | Primary Risk | Tax Treatment |
|---|---|---|---|
| Investment Grade Corp Bonds | 4.8% – 5.5% | Duration Risk | Ordinary Income |
| Preferred Stocks | 6.2% – 7.1% | Call Risk / Subordination | Qualified (Lower Rate) |
| Specialized REITs | 5.0% – 6.5% | Interest Rate Sensitivity | Section 199A (Deduction) |
(Source: J.P. Morgan Asset Management, 2026 Long-Term Capital Market Assumptions)
For 2026, Preferred Stocks represent a critical "middle-ground" for retirees. They offer equity-like yields but sit higher in the capital structure than common stock. We favor "Fixed-to-Float" structures to hedge against any late-cycle inflation spikes.
{
  "type": "bar",
  "title": "2026 Asset Yield vs. Inflation (Real Return Gap)",
  "index": "Asset",
  "categories": ["Nominal Yield", "Real Yield (Inflation Adj)"],
  "data": [
    {"Asset": "10-Yr Treasury", "Nominal Yield": 3.8, "Real Yield (Inflation Adj)": 1.6},
    {"Asset": "Preferreds (ETP)", "Nominal Yield": 6.4, "Real Yield (Inflation Adj)": 4.2},
    {"Asset": "Specialized REITs", "Nominal Yield": 5.8, "Real Yield (Inflation Adj)": 3.6},
    {"Asset": "HY Corporate", "Nominal Yield": 7.2, "Real Yield (Inflation Adj)": 5.0}
  ],
  "source": "Source: Bloomberg Terminal Data (Est. Jan 2026)",
  "note": "Real yield assumes a 2.2% headline CPI for 2026."
}
Strategic Insights for 2026:
- REIT Selectivity: Avoid broad-market REIT ETFs. Focus on Data Centers and Logistics (Cell Towers), which maintain pricing power. According to CBRE, these sectors show 85%+ lease renewal rates in 2026, securing the dividend base.
- Bond Laddering: Utilize Defined-Outcome Bond ETFs (e.g., iShares iBonds). These allow retirees to lock in 2026–2030 yields with a specific maturity date, eliminating the "perpetual duration" risk of traditional bond funds.
- The "Yield Kicker": Allocate 10% to Senior Loans. As floating-rate instruments, they provide a hedge if the 2026 economy runs hotter than consensus expectations.
So What? For a $1M portfolio, transitioning from a 2% yield (S&P 500) to a 5.5% blended income path generates an additional $35,000 in annual spendable cash without selling a single share, effectively neutralizing sequence-of-returns risk.
2026 Tax-Efficiency Checklist for Retirement Portfolios
The 2026 tax landscape has shifted from a "cliff" to a stable plateau, following the permanent extension of the Tax Cuts and Jobs Act (TCJA) via the One Big Beautiful Bill Act (OBBBA) of July 2025. This legislative certainty allows for aggressive, long-term tax-loss harvesting and Roth conversion strategies without the fear of immediate bracket spikes.
However, 2026 introduces two critical "tax-traps" for the unwary: mandatory Roth catch-ups and the Senior Bonus Deduction phase-outs.
The 2026 Account Matrix
To maximize real returns, you must align account types with your projected 2026 marginal rate.
| Feature | Traditional 401(k) / IRA | Roth 401(k) / IRA |
|---|---|---|
| 2026 Contribution Limit | $24,500 (+$8k catch-up) | $24,500 (+$8k catch-up) |
| Tax Impact at Withdrawal | Taxed as Ordinary Income | 100% Tax-Free |
| Required Minimum Dist. | Mandatory at age 73/75 | None (during life) |
| 2026 "Rothification" Rule | Not available for >$150k catch-up | Mandatory for catch-up if income >$150k |
| (Source: IRS Revenue Procedure 2025-32; SECURE 2.0 Act). |
 Photo by Nataliya Vaitkevich on Pexels
2026 Tax-Efficiency Checklist
- Audit the "Rothification" Requirement: If your 2025 FICA wages exceeded $150,000, all 2026 catch-up contributions ($8,000 standard; $11,250 for ages 60-63) must be Roth. Failure to adjust your payroll elective deferrals will result in administrative headaches and potential penalties.
- Leverage the Senior Bonus Deduction: Taxpayers 65+ now receive an additional $6,000 deduction (Source: OBBBA 2025). If your income is near the $150,000 joint phase-out, prioritize Traditional contributions to lower your MAGI and preserve this "bonus" deduction.
- Execute the "Super Catch-up": For those aged 60 to 63, 2026 allows a boosted catch-up of $11,250 (Source: SECURE 2.0). Use this three-year window to shift massive capital into tax-advantaged buckets before Required Minimum Distributions (RMDs) loom.
So What? For a high-earner (24% bracket), failing to utilize the $11,250 super catch-up represents a $2,700 immediate tax subsidy left on the table. In 2026, tax efficiency is no longer about predicting rates, but about precise bracket management around new legislative floors.
Risk Management: Protecting Your Best Investing for Retirement Portfolio
Tax efficiency is futile if Sequence of Returns Risk—the danger of a market crash occurring in the first three years of withdrawals—decimates your principal. For a retiree with a 4% withdrawal rate, a -15% return in Year 1 is mathematically harder to recover from than a -30% crash in Year 20.
In 2026, volatility is the baseline, not the exception. Protecting "real" returns requires moving from a static allocation to a Dynamic Bucket Strategy. This structural shift ensures you never sell equities during a drawdown.
Visual: Infographic: A three-tiered vertical funnel. Top Tier: "Bucket 1 - Liquidity" (Cash/CDs, 2 years). Middle Tier: "Bucket 2 - Stability" (IG Bonds/Dividends, 7 years). Bottom Tier: "Bucket 3 - Growth" (Global Equities/AI Tech, 10+ years). Arrows show rebalancing flow from growth to liquidity.
The 2026 Three-Bucket Framework
| Bucket | Asset Class Focus | Role in 2026 | Horizon |
|---|---|---|---|
| 1: Liquidity | Money Markets, T-Bills | Funding immediate lifestyle | 0-2 Years |
| 2: Income | TIPS, Corporate Bonds | Refilling the cash bucket | 3-10 Years |
| 3: Growth | Global Equities, Private Credit | Compounding long-term wealth | 10+ Years |
| (Source: Vanguard Investment Strategy Group, 2025 Outlook) |
Why Sequence Matters: A Quantitative Reality
Average returns are a myth in retirement. If your portfolio loses 10% early while you are withdrawing capital, you are liquidating shares at a discount, permanently lowering your portfolio’s ceiling.
{
  "type": "line",
  "title": "Portfolio Longevity: Bad vs. Good Sequence Start",
  "index": "Year",
  "categories": ["Early Bull Start", "Early Bear Start"],
  "data": [
    {"Year": 0, "Early Bull Start": 1000, "Early Bear Start": 1000},
    {"Year": 5, "Early Bull Start": 1150, "Early Bear Start": 780},
    {"Year": 10, "Early Bull Start": 1320, "Early Bear Start": 540},
    {"Year": 15, "Early Bull Start": 1480, "Early Bear Start": 210},
    {"Year": 20, "Early Bull Start": 1650, "Early Bear Start": 0}
  ],
  "source": "Source: Simulation based on BlackRock Retirement Institute data (2024)",
  "note": "Assumes $1M start, 4% inflation-adjusted withdrawal, and identical 7% avg. return over 20 years."
}
So What? In the 2026 market, "Set and Forget" is a recipe for ruin. By maintaining 24 months of cash, you gain the psychological and financial "dry powder" to ignore short-term volatility.
Managing these moving parts requires always-on research to determine which assets are ripe for rebalancing into your liquidity bucket. For investors seeking a professional-grade research workflow to track these shifts, Tritonix.ai provides the institutional-level data needed to maintain a resilient 2026 retirement strategy.
FAQ
What is the best asset allocation for retirement in 2026?
A diversified '60/40+' portfolio including 30% alternatives like private credit and infrastructure is projected to offer better real returns than traditional public-only splits.
How does inflation affect retirement investing in 2026?
With projected inflation at 3.2%, retirees must target positive real returns, as a 5% nominal yield only provides 1.8% in actual purchasing power growth.
Are low-cost index funds still effective for retirement?
Yes, they are efficiency leaders. Choosing a 0.03% expense ratio fund over a 1.00% active fund can save over $600,000 in wealth over a 30-year retirement horizon.
Why should retirees consider dividend growth stocks?
Dividend growth stocks provide rising income that historically outpaces inflation by 200-300 basis points, acting as a dynamic hedge against rising costs.
What is the 2026 'Super Catch-up' rule for retirement?
Under SECURE 2.0, individuals aged 60 to 63 can make a boosted catch-up contribution of $11,250 to their tax-advantaged retirement accounts in 2026.