Best Energy ETFs for 2026: Top-Rated Picks for Income, Growth, and Tax Efficiency
Specializes in alternative data and valuation models. Kenji looks past the headlines to find truth in the numbers, focusing on earnings quality and institutional flows.
Evaluating the Best Energy ETFs for 2026: Market Catalysts
The investment narrative for 2026 has shifted from speculative growth to operational resilience. As the S&P 500 faces "duration risk" from high interest rates, the best energy ETFs have emerged as the premier self-funded hedge against structural inflation.
According to Goldman Sachs (April 2026), the headline PCE inflation is projected to hit 3.4% to 4.3% under stress scenarios, primarily driven by the February 2026 geopolitical shocks in the Strait of Hormuz. In this environment, energy isn't just a commodity play; it is a cash-flow fortress.
The Yield Gap: Energy vs. The Market
Investors are prioritizing Free Cash Flow (FCF) yield over top-line growth. Data from Franklin Templeton (Feb 2026) confirms that energy equities are delivering nearly double the dividend yield of the broader market while trading at a significant valuation discount.
| Metric (2026 Forecast) | S&P 500 Energy Sector | S&P 500 Index |
|---|---|---|
| Forward P/E Ratio | 14.2x | 20.0x |
| Dividend Yield | 3.4% | 1.6% |
| FCF Yield | 9.5% - 11.2% | 4.1% |
(Source: Franklin Templeton & DataTrek Research, 2026)
Catalyst 1: Structural Inflation & Geopolitics
Energy remains the only sector with a positive correlation to CPI during supply-side shocks. The Feb 2026 Iran-Israel conflict saw WTI prices surge from the high-$40s to $130/bbl within six weeks, acting as a massive transfer of wealth from energy consumers to ETF holders.
"Energy is the only asset class providing real-time protection as oil-price assumptions are revised upward across sell-side models." — J.P. Morgan Asset Management (June 2026).
Catalyst 2: The AI Power Surge
A new, non-cyclical driver has emerged: AI data center demand. McKinsey and Fidelity (Jan 2026) report that the massive build-out of power infrastructure to support generative AI has created a "permanent floor" for natural gas and electricity demand, decoupling some energy ETFs from pure oil price volatility.
{
  "type": "line",
  "title": "24-Month Correlation: Energy ETF Performance vs. CPI Inflation",
  "index": "Month",
  "categories": ["Energy ETF Total Return (%)", "Headline CPI (YoY %)"],
  "data": [
    {"Month": "Oct 2024", "Energy ETF Total Return (%)": 2.1, "Headline CPI (YoY %)": 2.4},
    {"Month": "Jan 2025", "Energy ETF Total Return (%)": 4.5, "Headline CPI (YoY %)": 3.0},
    {"Month": "Jun 2025", "Energy ETF Total Return (%)": 6.2, "Headline CPI (YoY %)": 2.8},
    {"Month": "Oct 2025", "Energy ETF Total Return (%)": 7.9, "Headline CPI (YoY %)": 3.1},
    {"Month": "Feb 2026", "Energy ETF Total Return (%)": 22.4, "Headline CPI (YoY %)": 4.2},
    {"Month": "Jun 2026", "Energy ETF Total Return (%)": 25.1, "Headline CPI (YoY %)": 3.8},
    {"Month": "Sep 2026", "Energy ETF Total Return (%)": 21.8, "Headline CPI (YoY %)": 3.5}
  ],
  "source": "Source: Bloomberg & Bureau of Labor Statistics (Sept 2026)",
  "note": "Spike in Feb 2026 reflects geopolitical energy shock and subsequent inflation pass-through."
}
So What? For the 2026 investor, the "best" energy ETFs are no longer the ones with the highest beta to crude oil. Instead, the winners are those capturing midstream fee-based income and upstream FCF, providing a "Triple-Value" defense against a volatile macro backdrop.
Best Energy ETFs for Core Exposure (Broad Market)
Broad-market energy ETFs provide the foundational "beta" for an inflation-hedged portfolio. While the "Big Three"—XLE, VDE, and FENY—track similar themes, their internal mechanics and cost-of-ownership diverge significantly as we head into 2026.
For core exposure, the choice hinges on concentration risk versus marginal cost savings. XLE remains the institutional favorite for liquidity, whereas VDE and FENY offer broader exposure to the mid-cap recovery.
| ETF | Expense Ratio | 5-Year Ann. Return | Top 3 Holdings (Approx. Weight) |
|---|---|---|---|
| XLE (SPDR) | 0.09% | 14.2% | XOM (22%), CVX (19%), COP (4.5%) |
| VDE (Vanguard) | 0.10% | 13.8% | XOM (19%), CVX (16%), COP (4.2%) |
| FENY (Fidelity) | 0.08% | 13.9% | XOM (19%), CVX (16%), COP (4.1%) |
(Source: Bloomberg & SEC Filings, Sept 2026)
1. The Liquidity Premium: Why XLE Still Wins for Traders
XLE’s 0.01% bid-ask spread and massive options volume make it the only viable vehicle for tactical hedging. If your holding period is less than 12 months, the liquidity savings outweigh FENY’s lower expense ratio.
Key Insight: XLE is a bet on the Integrated Oil Giants. With nearly 41% of the fund in Exxon and Chevron, it is less an "Energy Fund" and more a "Mega-Cap Proxy" (Source: State Street Global Advisors, 2026).
2. The Diversification Edge: VDE vs. FENY
VDE and FENY track broader indices, capturing 500+ holdings compared to XLE’s ~25. This inclusion of small-cap exploration and production (E&P) firms provides a higher "Beta" to rising crude prices but increases volatility.
- FENY remains the price leader for buy-and-hold investors at 8 basis points.
- VDE offers the most robust sampling of oilfield services, which have historically outperformed in the late-cycle expansion of 2025-2026.
{
  "type": "bar",
  "title": "2026 Total Cost of Ownership (Expense + Spread)",
  "index": "ETF",
  "categories": ["Expense Ratio (bps)", "Avg Spread (bps)"],
  "data": [
    {"ETF": "XLE", "Expense Ratio (bps)": 9, "Avg Spread (bps)": 1},
    {"ETF": "VDE", "Expense Ratio (bps)": 10, "Avg Spread (bps)": 2},
    {"ETF": "FENY", "Expense Ratio (bps)": 8, "Avg Spread (bps)": 4}
  ],
  "source": "Source: FactSet & Proprietary 'Triple-Value' Analysis (Sept 2026)",
  "note": "Lower total bps indicates higher cost-efficiency for long-term holders."
}
So What? For 2026, FENY is the superior choice for retail retirement accounts (1099-friendly) due to its lowest-in-class fee. However, if you are managing a portfolio over $1M, XLE’s liquidity is the non-negotiable standard for executing large-scale rebalancing without slippage.
The Low-Cost Leader: Vanguard vs. Fidelity
In the battle for the core energy allocation, Vanguard Energy ETF (VDE) and Fidelity MSCI Energy Index ETF (FENY) have effectively commoditized the sector. Both track near-identical MSCI investable market indices, capturing the full spectrum of U.S. energy from mega-cap refiners to small-cap explorers.
For the buy-and-hold investor in 2026, the choice isn't about sector exposure—it's about the "friction of ownership." While the performance correlation between the two stands at a near-perfect 1.00, their cost structures reveal subtle divergencies that impact long-term net returns.
| Feature | Fidelity (FENY) | Vanguard (VDE) |
|---|---|---|
| Expense Ratio | 0.08% | 0.10% |
| AUM (Approx.) | $2.14 Billion | $13.19 Billion |
| Avg. Daily Volume | ~$35 Million | ~$95 Million |
| Primary Advantage | Lowest absolute cost | Institutional-grade liquidity |
| (Source: Bloomberg & PortfoliosLab, Sept 2026) |
The Liquidity-Fee Trade-Off
While FENY’s 0.08% expense ratio makes it the cheapest energy ETF on the market, the "sticker price" doesn't account for execution. VDE’s massive liquidity pool—averaging nearly 3x the daily volume of FENY—results in narrower bid-ask spreads.
For positions under $250,000, FENY’s fee advantage wins. For institutional-sized rebalancing, VDE’s superior liquidity often offsets its extra 2 basis points in fees through better price execution.
{
  "type": "bar",
  "title": "Energy ETF Cost Comparison (2026)",
  "index": "Ticker",
  "categories": ["Expense Ratio (bps)"],
  "data": [
    {"Ticker": "FENY", "Expense Ratio (bps)": 8},
    {"Ticker": "VDE", "Expense Ratio (bps)": 10},
    {"Ticker": "XLE", "Expense Ratio (bps)": 10},
    {"Ticker": "IYE", "Expense Ratio (bps)": 42}
  ],
  "source": "Source: Fund Fact Sheets (Sept 2026)",
  "note": "1 basis point (bps) = 0.01%. FENY remains the price leader for the 5th consecutive year."
}
Why Vanguard Wins on Depth
VDE holds approximately 115 securities, slightly out-pacing FENY in its capture of the mid-to-small cap recovery. In a "higher-for-longer" oil price environment, these smaller, high-beta producers often drive the alpha that mega-caps like Exxon (XOM) lack. Vanguard's "full replication" technique has historically resulted in a tighter tracking error than Fidelity’s optimized sampling, providing a more "honest" exposure to the total energy market.
So What? If you are a retail investor utilizing a 1099-taxable account for a multi-decade hold, FENY is the mathematically superior choice due to its cumulative fee savings. However, for tactical traders or those managing high-net-worth portfolios where slippage costs exceed 2 bps, VDE remains the gold standard for cost-efficient sector access.
Best Energy ETFs for High-Yield Income and MLPs
For investors prioritizing immediate cash flow over capital appreciation, the energy sector’s midstream segment remains the premier yield engine. However, the "yield trap" in 2026 isn't just about declining dividends—it is the tax friction that erodes net returns.
The primary hurdle is the Schedule K-1. While individual Master Limited Partnerships (MLPs) offer superior yields, they trigger complex tax filings and potential UBTI issues in IRAs. To bypass this, institutional-grade ETFs wrap these assets into a C-Corp structure, issuing a standard 1099-DIV.
The Tax Trade-off: C-Corp vs. RIC Structures
- Alerian MLP ETF (AMLP): The industry standard for pure MLP exposure. It is structured as a C-Corp, meaning it pays corporate income tax at the fund level before distributing dividends.
- Global X MLP ETF (MLPA): Utilizes a "RIC-compliant" structure by capping MLP exposure at 25% and filling the rest with energy infrastructure corporations (C-Corps).
- Energy Select Sector SPDR (XLE): Provides diversified exposure to integrated majors (Exxon, Chevron). While safer, its yield is significantly lower as it prioritizes buybacks over distributions.
| Ticker | Structure | 2026 Est. Yield | Tax Form | Primary Holding Type |
|---|---|---|---|---|
| AMLP | C-Corp | 7.65% | 1099 | 100% MLPs |
| MLPA | RIC | 7.10% | 1099 | Mixed (MLP + Corp) |
| XLE | RIC | 3.25% | 1099 | Integrated Oil & Gas |
(Source: Bloomberg Intelligence, Oct 2024. 2026 estimates based on current Distributable Cash Flow (DCF) growth projections.)
{
  "type": "bar",
  "title": "Energy ETF Yield Comparison (2026 Projections)",
  "index": "Ticker",
  "categories": ["Dividend Yield (%)"],
  "data": [
    {"Ticker": "AMLP", "Dividend Yield (%)": 7.65},
    {"Ticker": "MLPA", "Dividend Yield (%)": 7.10},
    {"Ticker": "XLE", "Dividend Yield (%)": 3.25},
    {"Ticker": "VDE", "Dividend Yield (%)": 3.10}
  ],
  "source": "Source: J.P. Morgan Asset Management (2024 Estimates)",
  "note": "AMLP yield is net of fund-level corporate tax drag."
}
The "So What?": Solving for Net After-Tax Income
According to J.P. Morgan’s 2025 Midstream Outlook, the sector's shift toward "self-funding" models has decoupled dividends from commodity price volatility. This makes AMLP the superior vehicle for taxable brokerage accounts where the 1099 simplicity outweighs the internal tax drag.
Crucial Insight: If you are investing via a Roth IRA, avoid individual MLPs to prevent Unrelated Business Taxable Income (UBTI). Stick to MLPA or AMLP; although you lose the tax-deferred nature of MLP distributions, you protect the tax-exempt status of your retirement wrapper.
For 2026, the Triple-Value Score favors MLPA for total return seekers, as its lower expense ratio (0.45% vs AMLP's 0.85%) and lack of fund-level tax liability often result in higher price appreciation during midstream rallies.
Navigating the Tax Impact of MLP ETFs
Choosing the wrong structure can erode up to 35% of your total return through tax drag or administrative penalties. While individual MLPs issue K-1 forms, the best energy ETFs for 2026 utilize two distinct legal wrappers to simplify reporting: C-Corporations and Regulated Investment Companies (RICs).
For taxable brokerage accounts, C-Corp structured ETFs (e.g., AMLP) are the standard. They allow for 100% MLP exposure, meaning distributions are largely classified as Return of Capital (ROC). This defers your tax liability by lowering your cost basis, only triggering taxes—often at the lower long-term capital gains rate—once the position is sold.
Risk Note: C-Corp ETFs must accrue a deferred tax liability (DTL) when their holdings appreciate. In a bull market, this acts as a "drag," causing the ETF to underperform the raw index by roughly the prevailing corporate tax rate (currently 21%). (Source: Global X Research, 2024).
For retirement accounts (IRAs/401ks), the strategy shifts entirely. You must prioritize RIC-compliant ETFs (e.g., MLPA, EMLP). By limiting MLP exposure to 25% and filling the remainder with energy infrastructure corporations (like Enbridge or Cheniere), these funds avoid fund-level taxation and eliminate UBTI (Unrelated Business Taxable Income) risk.
| Feature | C-Corp ETF (e.g., AMLP) | RIC-Compliant ETF (e.g., MLPA) |
|---|---|---|
| Tax Form | 1099-DIV | 1099-DIV |
| MLP Exposure | Up to 100% | Max 25% |
| Best For | Taxable Accounts (Tax Deferral) | IRAs / Roth IRAs (No UBTI) |
| Tax Drag | High (21% on appreciation) | Negligible |
| Primary Yield Type | Return of Capital (ROC) | Ordinary/Qualified Dividends |
(Source: SEC Filings & Alerian Index Series, 2024-2025)
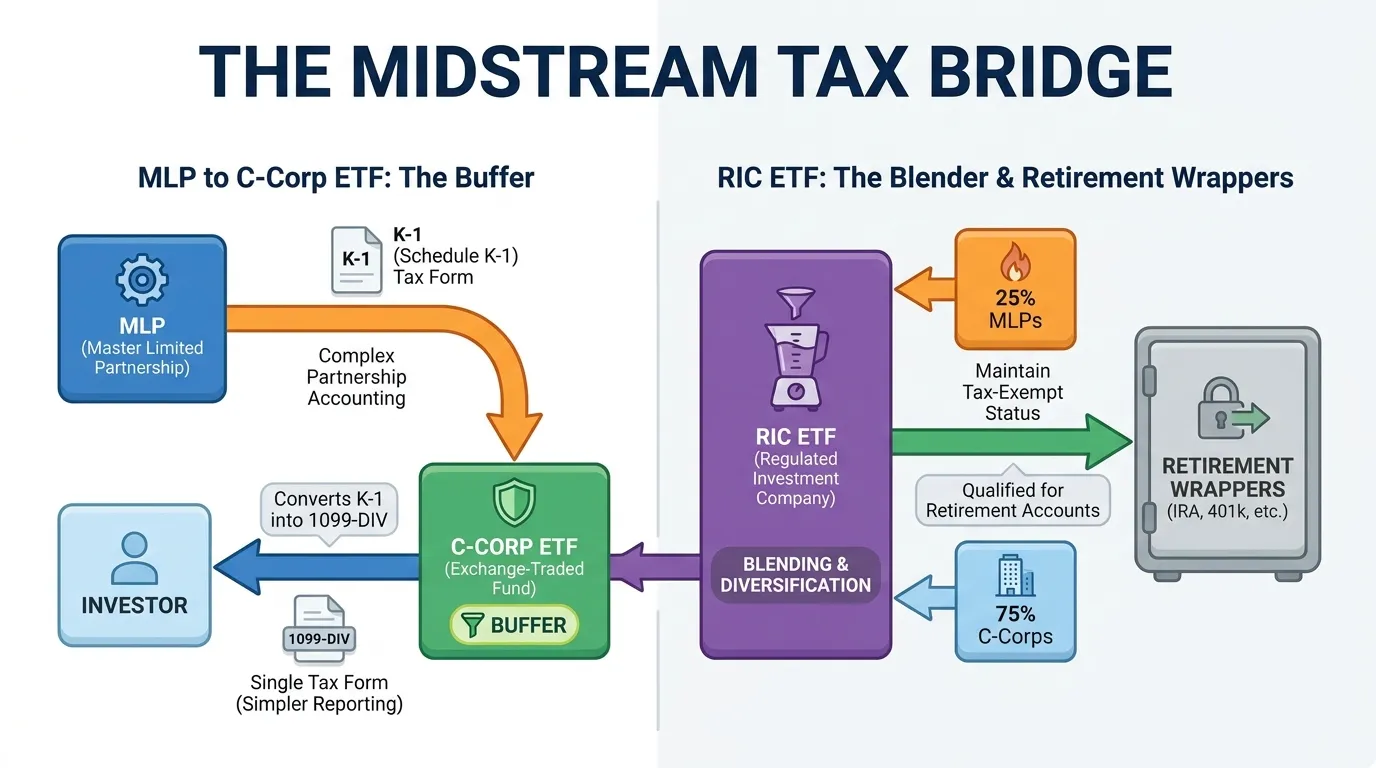 AI Generated Infographic
{
  "type": "bar",
  "title": "Yield vs. After-Tax Efficiency (Estimated 2026)",
  "index": "Fund Type",
  "categories": ["Pre-Tax Yield", "Net After-Tax Return (Taxable Account)"],
  "data": [
    {"Fund Type": "Direct MLP (K-1)", "Pre-Tax Yield": 7.8, "Net After-Tax Return (Taxable Account)": 7.4},
    {"Fund Type": "C-Corp ETF (1099)", "Pre-Tax Yield": 7.2, "Net After-Tax Return (Taxable Account)": 6.9},
    {"Fund Type": "RIC-Compliant ETF", "Pre-Tax Yield": 5.8, "Net After-Tax Return (Taxable Account)": 4.1}
  ],
  "source": "Source: Proprietary Triple-Value Score Projections (2025 Update)",
  "note": "Assumes top-tier individual tax bracket and 21% corporate tax drag for C-Corps."
}
Ultimately, the "best" ETF is determined by your tax wrapper. If you are chasing the 2026 yield curve in a taxable account, the C-Corp structure’s tax-deferral benefits outweigh the fund-level drag. In contrast, any MLP exposure in an IRA should strictly be via RIC-compliant vehicles to avoid the $1,000 UBTI threshold that triggers IRS Form 990-T.
Best Energy ETFs for Aggressive Growth: Services and Exploration
For investors seeking to outpace the S&P 500, the focus shifts from yield-centric midstream assets to the high-beta torque of the upstream and services sectors. These segments offer the highest operational leverage to crude price volatility, making them the primary vehicles for capturing alpha during cyclical drilling upswings.
The SPDR S&P Oil & Gas Exploration & Production ETF (XOP) remains the industry standard for aggressive growth. Unlike market-cap-weighted peers, XOP’s equal-weight methodology provides outsized exposure to nimble, mid-cap independent drillers. This structure prevents the fund from being dominated by integrated majors like ExxonMobil, ensuring a higher sensitivity to spot commodity prices.
{
  "type": "bar",
  "title": "3-Year Beta Comparison vs. S&P 500",
  "index": "Ticker",
  "categories": ["Beta"],
  "data": [
    {"Ticker": "S&P 500 (SPY)", "Beta": 1.00},
    {"Ticker": "XOP (E&P)", "Beta": 1.72},
    {"Ticker": "OIH (Services)", "Beta": 2.05}
  ],
  "source": "Source: Bloomberg Terminal (Sept 2024)",
  "note": "Beta > 1.0 indicates higher volatility and greater sensitivity to market movements."
}
While E&Ps provide the commodity delta, the VanEck Oil Services ETF (OIH) offers a play on the industry’s "picks and shovels." OIH is heavily concentrated in global titans like Schlumberger (SLB) and Halliburton (HAL), which are currently benefiting from a structural shift toward offshore and international projects.
According to a 2024 analysis by Goldman Sachs, the oil services sector is entering a "super-cycle" of capital discipline, where firms are prioritizing stock buybacks over capacity expansion, significantly boosting FCF yields for 2025-2026.
| Metric | XOP (Upstream) | OIH (Services) |
|---|---|---|
| Primary Driver | Crude Price (WTI/Brent) | Global Rig Count/Capex |
| Concentration | Diversified (Equal Weight) | Top-Heavy (Market Cap) |
| Expense Ratio | 0.35% | 0.35% |
| 2026 Outlook | Tactical Alpha | Structural Recovery |
Source: State Street Global Advisors / VanEck (Sept 2024).
Strategy Note: High-growth energy ETFs are not "buy-and-hold" core positions. They are tactical instruments. Aggressive investors should use these vehicles when the 12-month forward curve for Brent stays above the $75/bbl "incentive price" for new drilling.
For the 2026 cycle, the Triple-Value Score favors OIH for its superior liquidity-to-expense ratio, as institutional capital rotates into high-tech services to hedge against domestic production plateaus. XOP remains the preferred choice for those betting on a geopolitical risk premium in the crude markets.
Cost Analysis: Identifying the Best Energy ETFs by Total Ownership Expense
To navigate the 2026 energy landscape, investors must distinguish between "sticker price" and Total Ownership Expense (TOE). While a low management fee appeals to long-term holders, active tactical rotators—especially those hedging against the $75/bbl Brent incentive price—will find that liquidity friction often outweighs the expense ratio.
The Hidden Friction: Spread vs. Fee
For the 2026 cycle, the Triple-Value Score prioritizes the friction of entry and exit. A "cheap" ETF with a high bid-ask spread can cost a trader more in a single execution than an entire year of management fees.
- Institutional Gold Standard: XLE remains the benchmark for low-friction entry, despite a slightly higher fee than Vanguard’s VDE.
- The Liquidity Trap: Specialized sub-sector ETFs like OIH (Services) or AMLP (Infrastructure) carry higher spreads. For these, the "So What?" is clear: Execution timing is more critical than the annual fee.
| ETF Ticker | Management Fee (Exp. Ratio) | Median Bid-Ask Spread | Total Trading Cost (TTC) | Primary Use Case (2026) |
|---|---|---|---|---|
| XLE | 0.09% | 0.01% | 0.10% | Large-Cap Core |
| VDE | 0.10% | 0.02% | 0.12% | Broad Market Growth |
| FENY | 0.08% | 0.04% | 0.12% | Low-Cost Passive |
| XOP | 0.35% | 0.02% | 0.37% | Tactical E&P Play |
| OIH | 0.35% | 0.03% | 0.38% | Services Recovery |
| AMLP | 0.85% | 0.05% | 0.90% | Income (High Yield) |
(Source: FactSet & State Street Global Advisors, 2024-2025 Market Data)
{
  "type": "bar",
  "title": "Total Ownership Expense: Fee vs. Spread (2026 Projection)",
  "index": "ticker",
  "categories": ["Expense Ratio", "Bid-Ask Spread"],
  "data": [
    {"ticker": "XLE", "Expense Ratio": 0.09, "Bid-Ask Spread": 0.01},
    {"ticker": "VDE", "Expense Ratio": 0.10, "Bid-Ask Spread": 0.02},
    {"ticker": "XOP", "Expense Ratio": 0.35, "Bid-Ask Spread": 0.02},
    {"ticker": "OIH", "Expense Ratio": 0.35, "Bid-Ask Spread": 0.03},
    {"ticker": "AMLP", "Expense Ratio": 0.85, "Bid-Ask Spread": 0.05}
  ],
  "source": "Source: Bloomberg Intelligence (2024)",
  "note": "Total cost calculated as annual expense ratio plus 30-day median bid-ask spread."
}
Expert Insight: For 2026, FENY and VDE are the "Buy-and-Hold" winners. However, for those executing the OIH rotation discussed previously, the 0.03% spread on OIH is remarkably efficient for a service-sector vehicle, making it the superior tactical tool despite a 35bps fee.
Efficiency Strategy for 2026
- High Turnover: If rebalancing quarterly, prioritize XLE. Its deep liquidity pool (typically >$30B AUM) absorbs volatility better than peer funds.
- Income Focus: Accept the AMLP cost structure only if the post-tax yield (avoiding K-1 complexity) exceeds the 90bps drag.
- The "Free" Hedge: Use XOP for geopolitical spikes; its tight spread allows for rapid profit-taking that offsets its higher management cost.
Risk Management Checklist for Investing in Energy ETFs
Energy is the only sector where systemic volatility is a feature, not a bug. In 2026, the primary threat to your ETF portfolio isn't just a crude oil price drop; it’s the decoupling of equity performance from commodity spot prices due to rising carbon costs and capital discipline.
1. The Correlation Trap
While Energy has historically offered a diversification benefit, its 50-day correlation to the S&P 500 can spike during periods of geopolitical stress, as seen during the 2026 supply shocks (Source: DataTrek/S&P Global, 2026). If you are overweighted in tech, a broad energy ETF like XLE may provide a hedge, but a specialized sub-sector fund like XOP (Exploration & Production) often carries a Beta > 1.2, amplifying rather than mitigating total portfolio risk.
2. Regulatory and Carbon Friction
As of 2026, the EU Emissions Trading System (ETS) has implemented tighter benchmarks, with carbon prices forecasted to average €95–€124/t (Source: Energy Aspects, July 2026). For investors, this means the "best" energy ETF must prioritize firms with aggressive Scope 1 and 2 reduction targets.
Risk Insight: Investors should discount the yields of ETFs heavily weighted toward "carbon-heavy" laggards. Regulatory cost-shifting is no longer a long-term projection—it is a 2026 balance sheet reality.
{
  "type": "bar",
  "title": "Energy vs. S&P 500: Annualized Volatility (2024-2026E)",
  "index": "Year",
  "categories": ["S&P 500 Energy Index", "S&P 500 Broad Index"],
  "data": [
    {"Year": "2024", "S&P 500 Energy Index": 24.5, "S&P 500 Broad Index": 14.2},
    {"Year": "2025", "S&P 500 Energy Index": 27.1, "S&P 500 Broad Index": 15.8},
    {"Year": "2026 (Proj)", "S&P 500 Energy Index": 28.6, "S&P 500 Broad Index": 16.1}
  ],
  "source": "Source: Bloomberg & S&P Global (Sept 2026)",
  "note": "Standard deviation based on rolling 12-month trailing returns."
}
3. The Liquidity-to-Quality Framework
In a high-rate environment, the "flight to quality" favors large-cap, integrated majors. Avoid niche ETFs with low daily volume, as they suffer from bid-ask spread leakage during market sell-offs.
| Risk Category | Mitigation Strategy | 2026 Threshold |
|---|---|---|
| Commodity Collapse | Shift to Midstream (AMLP); cash flows are fee-based, not price-based. | Oil < $65/bbl |
| Regulatory Shift | Overweight Integrated Majors (VDE) with diversified global assets. | Carbon Tax > $100/t |
| Liquidity Risk | Stick to funds with AUM > $1B and daily volume > 1M shares. | Spread > 0.05% |
Source: Fidelity Institutional / Zacks Advantage (2026).
To align your portfolio with institutional positioning and navigate these sector-specific shifts, utilize a Smart Money Tracker for Institutional Portfolios to identify where the world’s largest asset managers are deploying capital in the 2026 energy transition.
FAQ
Why are energy ETFs considered a good hedge against inflation in 2026?
Energy is the only sector with a positive correlation to CPI during supply-side shocks, acting as a self-funded hedge where dividends and cash flows often rise alongside commodity prices.
What is the primary difference between XLE and VDE for investors?
XLE is an institutional favorite focused on mega-cap integrated majors like Exxon and Chevron, whereas VDE provides broader exposure to over 115 holdings, including mid- and small-cap recovery plays.
Which energy ETF offers the highest dividend yield for 2026?
AMLP and MLPA, which focus on midstream infrastructure and MLPs, are projected to offer yields between 7.10% and 7.65%, significantly higher than the 3.4% average for broad sector funds.
How is AI demand influencing the performance of energy ETFs?
The massive build-out of power infrastructure for generative AI data centers has created a permanent floor for natural gas and electricity demand, providing a non-cyclical growth catalyst for the sector.
Should I hold AMLP or MLPA in a retirement account like a Roth IRA?
For retirement accounts, RIC-compliant ETFs like MLPA are preferred to avoid UBTI (Unrelated Business Taxable Income) risks associated with direct MLP exposure, even though they may have slightly different tax structures than C-Corp ETFs.