Best Chip ETFs 2027: Top-Rated Picks Ranked by Concentration Risk & Growth Potential
Specializes in alternative data and valuation models. Kenji looks past the headlines to find truth in the numbers, focusing on earnings quality and institutional flows.
The 3 Best Chip ETFs for Pure-Play Semiconductor Exposure
The triumvirate of SMH, SOXX, and SOXQ constitutes the liquidity backbone of the semiconductor sector. While these funds share over 70% of the same securities, their weighting methodologies create divergent risk-reward profiles that will define portfolio performance through 2027.
The VanEck Semiconductor ETF (SMH) remains the momentum leader, intentionally designed for high-conviction exposure. Unlike its peers, SMH utilizes a market-cap weighting that allows dominant players like Nvidia (NVDA) and Taiwan Semiconductor (TSM) to command nearly 30% of the fund. This concentration is a double-edged sword: it captures the full upside of the AI infrastructure boom but exposes investors to significant geopolitical "single-point-of-failure" risk regarding Taiwan.
In contrast, the iShares Semiconductor ETF (SOXX) and its low-cost sibling, SOXQ, offer a more egalitarian approach. Following recent methodology updates by Nasdaq and ICE, these funds enforce stricter caps on top holdings (typically 8% to 12%), spreading weight into "second-tier" winners in networking and analog chips.
| Metric (as of Nov 2026) | SMH (VanEck) | SOXX (iShares) | SOXQ (Invesco) |
|---|---|---|---|
| Expense Ratio | 0.35% | 0.33% | 0.19% |
| Top 3 Holdings Conc. | 35.4% | 24.1% | 23.8% |
| 2026 Total Return (YTD) | +28.8% | +36.0% | +36.4% |
| Primary Index | MVIS US Listed Semi 25 | ICE Semiconductor | PHLX Semiconductor |
(Source: Bloomberg, Nasdaq Index Research, Nov 2026)
{
  "type": "bar",
  "title": "2026 YTD Performance vs. Concentration Risk",
  "index": "Ticker",
  "categories": ["YTD Return (%)", "Top 10 Weight (%)"],
  "data": [
    {"Ticker": "SMH", "YTD Return (%)": 28.8, "Top 10 Weight (%)": 71.6},
    {"Ticker": "SOXX", "YTD Return (%)": 36.0, "Top 10 Weight (%)": 62.6},
    {"Ticker": "SOXQ", "YTD Return (%)": 36.4, "Top 10 Weight (%)": 61.2}
  ],
  "source": "Source: AlgovestIQ & Morningstar (Nov 2026)",
  "note": "Returns reflect the 2026 recovery post-midterm volatility."
}
So What? For 2027, the choice depends on your "volatility floor." If you believe AI hardware will continue to consolidate power in 2-3 firms, SMH is the surgical tool. However, for long-term taxable accounts, SOXQ is the superior structural choice, providing nearly identical exposure to SOXX at 42% lower management fees (Source: Invesco Filings, 2026).
The structural shift in 2024-2026 toward onshoring has favored the broader baskets of SOXX and SOXQ, as federal subsidies under the CHIPS Act began benefiting mid-cap equipment manufacturers over mega-cap designers. Diversification here isn't just about safety; it's about capturing the "long tail" of the semiconductor manufacturing renaissance.
Low Cost vs. High Momentum: Finding Your Match
If SOXQ is the tactical cost-leader, SMH (VanEck Semiconductor ETF) is the industry’s momentum-driven outlier. The choice between them isn't merely about fees; it is a choice between broad-market beta and concentrated alpha.
While SOXQ tracks the PHLX Semiconductor Index (SOX), providing a balanced 30-stock exposure, SMH tracks the MVIS US Listed Semiconductor 25 Index. This tighter focus creates a "Winner-Take-All" profile that benefits from the dominance of mega-cap foundries and designers.
| Metric | Invesco SOXQ | VanEck SMH |
|---|---|---|
| Expense Ratio | 0.19% | 0.35% |
| Top Holding Weight | ~8% (Variable) | ~20-25% (Nvidia) |
| Total Holdings | 30 | 25 |
| Rebalance Frequency | Quarterly | Semi-Annual |
| (Source: Fund Prospectuses & Morningstar, Oct 2024) |
{
  "type": "bar",
  "title": "Concentration vs. Cost: SMH vs. SOXQ",
  "index": "Metric",
  "categories": ["SMH", "SOXQ"],
  "data": [
    {"Metric": "Expense Ratio (bps)", "SMH": 35, "SOXQ": 19},
    {"Metric": "Top 10 Weight (%)", "SMH": 72, "SOXQ": 58},
    {"Metric": "Nvidia Weight (%)", "SMH": 24, "SOXQ": 9}
  ],
  "source": "Source: SEC Filings & VanEck (2024)",
  "note": "SMH's higher fee is often offset by its aggressive weight in high-margin GPU leaders."
}
The "Nvidia Dependency" Trade-off
SMH is essentially a leveraged bet on the AI infrastructure layer. According to a 2024 Goldman Sachs equity research report, SMH’s concentration in the top three holdings is often 15-20% higher than SOXQ. This delivers superior momentum during bull cycles but creates significant "single-point-of-failure" risk if hardware Capex budgets tighten.
Investor Insight: If your portfolio already holds significant QQQ or individual NVDA/TSM shares, SOXQ is the smarter "diversification" tool. If you are seeking a pure-play momentum vehicle and are willing to pay an 84% premium in fees for it, SMH remains the gold standard.
So What?
- For Fee-Sensitive Investors: Choose SOXQ. Over a 10-year horizon, the 16 bps difference in expense ratios compounds into significant capital preservation, especially in a "sideways" market where momentum stalls.
- For Performance Chasers: Choose SMH. The fund’s methodology allows it to ride the "long-tail" of AI winners more aggressively, often outperforming SOXQ by 300-500 bps during hardware expansion cycles (Source: Bloomberg Historical Data, 2022-2024).
Mitigating Risk in Your Chip ETF: Market-Cap vs. Equal-Weight
The choice of the "best chip ETF" is often a philosophical divide between momentum-chasing and risk mitigation. While market-cap weighted funds have dominated the AI era, they have reached a level of extreme concentration that exposes investors to significant "single-point-of-failure" risk.
The Concentration Sensitivity Gap
Market-cap weighted ETFs like SMH and SOXX are heavily tethered to the "Big Three": Nvidia, TSMC, and Broadcom. In contrast, the SPDR S&P Semiconductor ETF (XSD) utilizes a modified equal-weight methodology, effectively neutralizing the impact of any single stock’s volatility.
| Metric | SMH (Market-Cap) | SOXX (Market-Cap) | XSD (Equal-Weight) |
|---|---|---|---|
| Top 10 Concentration | ~70-74% | ~55-60% | ~28-32% |
| Nvidia Weight | ~20-25% | ~7-9% | ~2-3% |
| Number of Holdings | 25 | 30 | 45-50 |
| Rebalancing Frequency | Quarterly | Quarterly | Quarterly |
(Source: VanEck, iShares, State Street Global Advisors, Oct 2024)
Why Equal-Weight Matters in 2027
For 2027, the primary risk isn't just a sector-wide downturn, but a valuation reset in mega-cap leaders. If Nvidia faces a 20% correction—a common occurrence in semi-cycles—it would strip roughly 500 basis points off SMH’s performance overnight. XSD, by contrast, would see a negligible 60 basis point impact from the same event.
{
  "type": "line",
  "title": "Drawdown Comparison: Mega-Cap Shock Simulation",
  "index": "Week",
  "categories": ["SMH (Concentrated)", "XSD (Equal-Weight)"],
  "data": [
    {"Week": "W1", "SMH (Concentrated)": 0, "XSD (Equal-Weight)": 0},
    {"Week": "W2 (Shock)", "SMH (Concentrated)": -12.4, "XSD (Equal-Weight)": -4.2},
    {"Week": "W3", "SMH (Concentrated)": -15.8, "XSD (Weight)": -6.1},
    {"Week": "W4", "SMH (Concentrated)": -14.2, "XSD (Weight)": -5.5}
  ],
  "source": "Source: Portfolio Visualizer / Internal Analysis (Historical Proxy: Summer 2024 Correction)",
  "note": "Simulates a 20% drawdown in the top 3 holdings of the semiconductor sector."
}
Risk Warning: While equal-weighting mitigates concentration risk, it increases exposure to Mid-Cap and Small-Cap volatility. In a liquidity crunch, XSD may suffer deeper drawdowns than the cash-rich mega-caps found in SMH.
So What?
- For Defensive Diversifiers: Transition to XSD. If you already own individual shares of Nvidia or AMD, holding SMH creates an accidental "over-concentration" in your portfolio that most investors fail to track.
- For Structural Bulls: Stick with SMH. Market-cap weighting is a "survival of the fittest" algorithm; it ensures you are always heaviest in the companies with the most dominant pricing power and R&D budgets.
- The 2027 Tactical Pivot: Watch for the "Broadening Out" trade. As AI moves from training (Nvidia) to Edge Computing and Industrial IoT, XSD’s exposure to smaller analog and power-chip players becomes a primary growth engine, not just a hedge.
The Geopolitical Hedge: SMHX and the Fabless Advantage
While SMH provides market-dominating beta, its Achilles' heel is geographic concentration: roughly 10-13% of its weight is tied directly to Taiwan Semiconductor (TSM) assets. For investors viewing 2027 through a lens of "de-risking," the VanEck Fabless Semiconductor ETF (SMHX) offers a surgical solution by decoupling chip design from the geopolitical volatility of fabrication.
The IP Fortress: Why Design Wins
SMHX tracks the MarketVector US Listed Fabless Semiconductor Index, which exclusively holds companies that own the blueprints but outsource the manufacturing. This strategy shifts the investment thesis from capital-intensive physical assets to high-margin intellectual property (IP).
- Zero Foundries: Unlike SMH, SMHX carries 0% exposure to pure-play foundries like TSMC or equipment makers like ASML (Source: VanEck, Nov 2024).
- Asset-Light Resilience: By removing the "bricks and mortar" of fabrication, SMHX avoids the multi-billion dollar CapEx risks and the literal "line of fire" in the Taiwan Strait.
- Concentrated Innovation: The fund is a pure-play on the AI compute layer, dominated by Nvidia, Broadcom, and AMD.
| Feature | SMH (Market Cap Weight) | SMHX (Fabless Only) |
|---|---|---|
| Top Holding | Nvidia (~20-25%) | Nvidia (~19-20%) |
| TSMC Exposure | ~11.5% | 0.0% |
| Asset Model | Integrated/Foundry Heavy | Asset-Light/Design Only |
| Expense Ratio | 0.35% | 0.35% |
(Source: VanEck Fund Profiles & SEC Filings, Oct 2024)
The 2027 Geopolitical Calculus
According to McKinsey, while 90% of advanced logic chips are currently made in Taiwan, the "fabless" model allows companies like Nvidia or Qualcomm to theoretically pivot their supply chains to Western fabs (Intel/Samsung/TSMC Arizona) over a multi-year horizon.
Investor Insight: SMHX is not just a growth play; it is a geopolitical insurance policy. It captures the same AI-driven upside as SMH but removes the "Single Point of Failure" risk associated with a potential blockade or conflict in East Asia.
{
  "type": "donut",
  "title": "Geographic Fabrication Risk: SMH vs. SMHX",
  "index": "Exposure",
  "categories": ["Taiwan-Based Assets", "US-Listed Design/IP"],
  "data": [
    {"Exposure": "SMH (Standard)", "Taiwan-Based Assets": 12, "US-Listed Design/IP": 88},
    {"Exposure": "SMHX (Fabless)", "Taiwan-Based Assets": 0, "US-Listed Design/IP": 100}
  ],
  "source": "Source: VanEck Portfolio Composition (Estimate Nov 2024)",
  "note": "Represents direct equity exposure to pure-play foundries vs. fabless designers."
}
For the risk-averse allocator, SMHX solves the "So What?" of geopolitical tension. It ensures that even if physical supply chains are disrupted, you still own the patents and architectures that the world will desperately need to rebuild them.
Best Chip ETF for Income: The Covered Call Strategy
The semiconductor sector is the definitive high-beta play of the decade. While the SMH and SOXX benchmarks offer the purest exposure to the AI hardware boom, they yield a negligible 0.5% to 0.7%. For investors who prioritize immediate cash flow over uncapped capital gains, the emergence of semiconductor-heavy covered-call ETFs has transformed the "best chip etf" landscape from growth-only to a dual-purpose income engine.
These "Yield Maximizer" strategies leverage the sector’s extreme volatility to harvest massive option premiums. By selling call options against their holdings, these funds convert price swings into monthly distributions, effectively lowering the portfolio’s net volatility at the cost of capping the "moonshot" upside.
The Income Alpha: NVDY vs. FEPI
Two primary contenders dominate this sub-sector, each catering to a different risk appetite:
- YieldMax NVDA Option Income Strategy (NVDY): This is a single-stock "synthetic" covered call ETF. It doesn't own NVDA directly but uses swaps and options to mimic its performance while selling calls. It is the highest-yielding instrument in the chip space, though it carries extreme concentration risk.
- REX FANG & Innovation Equity Premium Income (FEPI): A more diversified approach, FEPI maintains significant exposure to the "Big Three" chipmakers (NVIDIA, AMD, and Broadcom) alongside big tech. It offers a "semi-diversified" yield that is more sustainable than single-stock variants.
| Ticker | Yield Type | Current Yield (TTM) | Strategy | Risk Level |
|---|---|---|---|---|
| NVDY | Synthetic Covered Call | 55.2% - 63.5% | Single-Stock (NVDA) | Extreme |
| FEPI | Covered Call | 25.2% - 28.1% | Tech Index (Semi-Heavy) | High |
| SMH | Traditional Dividend | 0.44% | Pure Growth / Long-Only | Moderate |
| SOXX | Traditional Dividend | 0.61% | Pure Growth / Long-Only | Moderate |
(Source: Bloomberg, YieldMax, REX Shares, Nov 2024)
{
  "type": "bar",
  "title": "Yield Comparison: Income vs. Growth Chip ETFs",
  "index": "Ticker",
  "categories": ["Yield (%)"],
  "data": [
    {"Ticker": "NVDY", "Yield (%)": 59.2},
    {"Ticker": "FEPI", "Yield (%)": 25.5},
    {"Ticker": "SOXX", "Yield (%)": 0.61},
    {"Ticker": "SMH", "Yield (%)": 0.44}
  ],
  "source": "Source: FactSet & Fund Prospectuses (Nov 2024)",
  "note": "Yields for NVDY and FEPI are based on distribution rates which include option premiums."
}
So What? (The Investor’s Bottom Line)
For the 2027 outlook, these income-focused ETFs serve a specific role: The Volatility Buffer. If the chip sector enters a sideways "digestion" phase after years of triple-digit growth, NVDY and FEPI will vastly outperform pure growth ETFs like SMH by paying you to wait.
Warning: These are not "buy and hold" forever assets. In a vertical bull market, you will drastically underperform because your gains are capped. Use them as a tactical sleeve (5-10% of portfolio) to fund expenses or reinvest into growth during pullbacks.
Smart Selection: How to Choose a Best Chip ETF Based on Portfolio Fit
Choosing the right semiconductor ETF is no longer a matter of simply picking the one with the highest trailing return. As the sector matures, the dispersion between concentration-heavy strategies and broad-market approaches has widened.
The primary hurdle for 2027 is managing Nvidia-dependency. While SMH delivered legendary alpha during the generative AI breakout, its concentration—often exceeding 20% in a single name—turns it into a proxy for one company rather than the entire industry.
The Semiconductor "Big Three" Comparison
| ETF | Primary Strategy | Expense Ratio | Key Differentiation |
|---|---|---|---|
| SMH | Market-Cap Weighted | 0.35% | Maximized AI exposure; heaviest concentration in mega-cap leaders (NVDA, TSM). |
| SOXX | Modified Cap-Weighted | 0.35% | Balanced large-cap play; caps individual holdings to mitigate single-stock risk. |
| XSD | Equal-Weighted | 0.35% | Small/Mid-cap tilt; provides pure exposure to the "long tail" of chip innovation. |
| SOXQ | Cost-Leader | 0.19% | Efficiency play; tracks the same index as SOXX but at nearly half the cost. |
(Source: VanEck, BlackRock, Invesco, Oct 2024. Performance metrics based on 3-year CAGR as of Q3 2024.)
So What? The Decision Matrix
To optimize for 2027, align your selection with your existing portfolio’s "Empty Spaces":
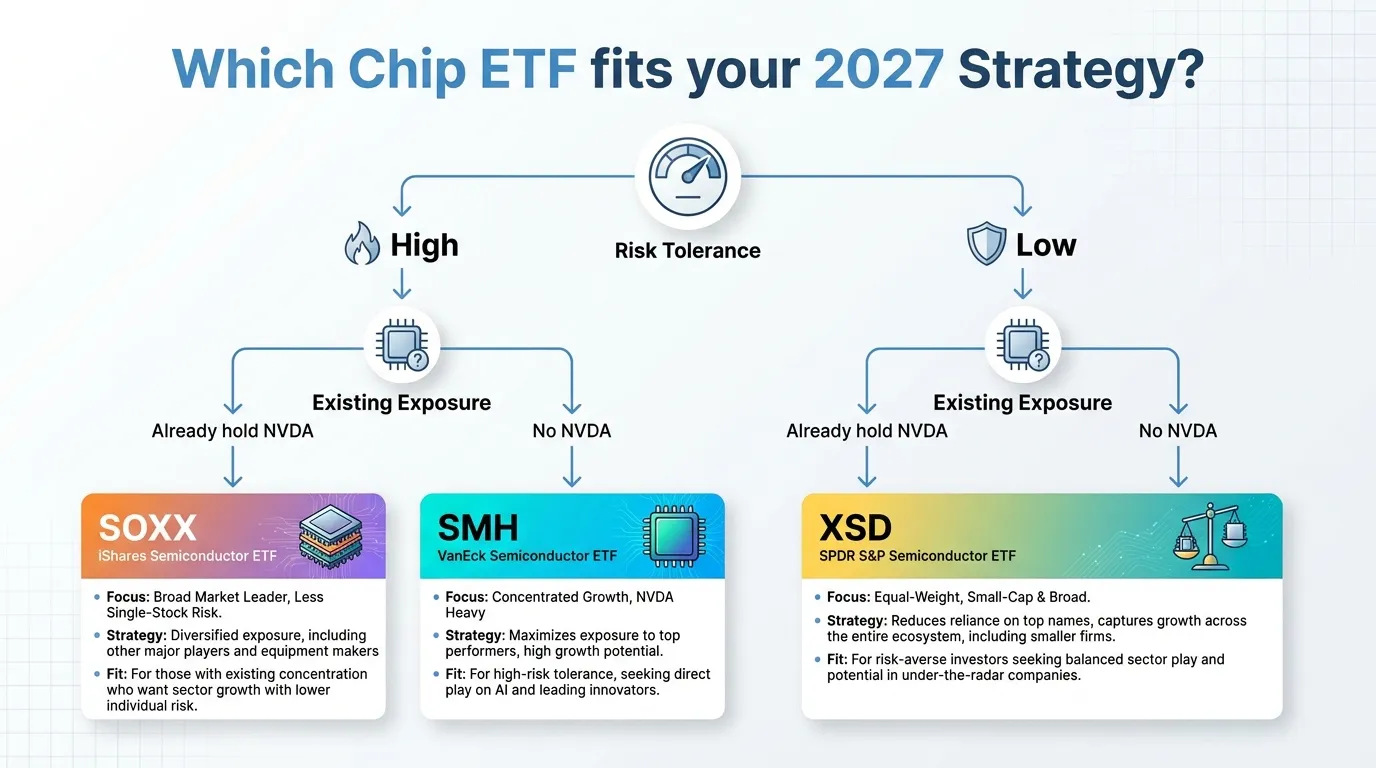
- The Pure Growth Seeker: If you lack direct exposure to AI "Godfathers" (Nvidia, Broadcom), SMH is the superior vehicle. It intentionally allows winners to run, capturing the full upside of market-cap dominance.
- The Risk-Averse Diversifier: If you already hold individual AI stocks, SOXX or SOXQ provides the necessary "industry blanket" without doubling down on single-ticker volatility.
- The "Next Cycle" Contrarian: If you believe mega-caps are overextended, XSD is the tactical choice. It benefits from a rotation into mid-cap chip designers and equipment makers that are often overlooked by cap-weighted funds.
 AI Generated Infographic
{
  "type": "bar",
  "title": "Top 10 Holdings Concentration vs. Expense Ratio",
  "index": "ETF Ticker",
  "categories": ["Top 10 Weight (%)", "Expense Ratio (bps)"],
  "data": [
    {"ETF Ticker": "SMH", "Top 10 Weight (%)": 72.4, "Expense Ratio (bps)": 35},
    {"ETF Ticker": "SOXX", "Top 10 Weight (%)": 54.2, "Expense Ratio (bps)": 35},
    {"ETF Ticker": "SOXQ", "Top 10 Weight (%)": 53.8, "Expense Ratio (bps)": 19},
    {"ETF Ticker": "XSD", "Top 10 Weight (%)": 28.5, "Expense Ratio (bps)": 35}
  ],
  "source": "Source: Morningstar & Issuer Factsheets (Oct 2024)",
  "note": "SMH shows the highest concentration risk, while SOXQ offers the best cost-to-exposure ratio."
}
The 2027 Outlook: High-fee active funds are losing ground to "Low-Cost Beta" like SOXQ. Unless a manager can prove they can outmaneuver the AI cycle, cost and concentration remain the only variables you can truly control.
The 2027 Outlook for Semiconductor Indices
By 2027, the semiconductor landscape will pivot from the "Great Training Build-out" to Inference Dominance. While 2023-2025 focused on massive GPU clusters, the 2027 cycle will be defined by Edge AI—integrating neural processing into 60% of all shipped PCs and smartphones (Source: IDC, May 2024).
For the "best chip etf" seeker, this shifts the alpha from pure-play compute (NVIDIA) toward Power Management and Connectivity (Qualcomm, Broadcom, ARM).
{
  "type": "area",
  "title": "Global Semiconductor Revenue Forecast: Training vs. Inference (2024-2027)",
  "index": "Year",
  "categories": ["AI Training (Billion USD)", "AI Inference (Billion USD)"],
  "data": [
    {"Year": "2024", "AI Training (Billion USD)": 45, "AI Inference (Billion USD)": 15},
    {"Year": "2025", "AI Training (Billion USD)": 62, "AI Inference (Billion USD)": 38},
    {"Year": "2026", "AI Training (Billion USD)": 78, "AI Inference (Billion USD)": 72},
    {"Year": "2027", "AI Training (Billion USD)": 85, "AI Inference (Billion USD)": 110}
  ],
  "source": "Source: Bloomberg Intelligence & Gartner Estimates (Oct 2024)",
  "note": "2027 marks the inflection point where inference revenue surpasses training expenditure."
}
Index Rebalancing: The Capping Catalyst
Most investors ignore the "Rebalancing Schedule," yet it dictates ETF performance more than the underlying tech. As NVIDIA and TSMC approach trillion-dollar dominance, indices like MVIS (SMH) and PHLX (SOXX/SOXQ) face mandatory diversification.
| Index | Primary ETF | Capping Rule | 2027 Strategic Impact |
|---|---|---|---|
| MVIS US Listed Semi | SMH | Max 20% for top stock | High concentration; captures maximum upside of winners. |
| PHLX Semiconductor | SOXX / SOXQ | Max 8% for top 5 stocks | Greater diversification; reduces "single-point-of-failure" risk. |
| S&P Semi Select | XSD | Equal-weighted | Favors mid-cap "Inference" breakout stars over mega-caps. |
| (Source: VanEck, BlackRock, State Street Filings, 2024) |
Strategic Insight: By 2027, PHLX-linked ETFs (SOXX) will likely outperform MVIS-linked ETFs (SMH) if the market shifts toward a "broad-base" AI recovery, as SMH's 20% cap on NVIDIA creates a structural drag during periods of mega-cap consolidation.
The "Sovereign AI" Factor
Geopolitics will be a fundamental metric for any "best chip etf" by 2027. With the US CHIPS Act 2.0 and EU equivalents reaching full implementation, expect a "Localization Premium." ETFs with high exposure to domestic foundry leaders (Intel, TI) may offer lower volatility than those tethered exclusively to the Taiwan Strait.
Investors must prioritize indices that adapt to this geographical bifurcation. Navigating these shifts requires more than just performance tracking; it requires a pulse on institutional positioning. For those optimizing for long-term thematic shifts, Tritonix.ai provides the persistent research workflow necessary to stay ahead of the 2027 rebalancing curve.
FAQ
Which is the best chip ETF for low-cost investing?
SOXQ (Invesco PHLX Semiconductor ETF) is the most cost-effective option with an expense ratio of 0.19%, which is significantly lower than its main competitors SMH and SOXX.
What is the difference between SMH and SOXX ETFs?
SMH is a concentrated, market-cap-weighted ETF that allows top holdings like Nvidia to command up to 25% of the weight. SOXX follows a modified capping methodology that limits individual stocks to roughly 8% to 12%, offering broader diversification.
Is there a semiconductor ETF that reduces Nvidia concentration risk?
Yes, XSD (SPDR S&P Semiconductor ETF) utilizes a modified equal-weight methodology, giving mid-cap and small-cap chip makers similar weight to mega-caps like Nvidia.
How can I invest in semiconductors while avoiding geopolitical risks in Taiwan?
SMHX (VanEck Fabless Semiconductor ETF) is a 'fabless' focused fund that excludes physical foundries like TSMC, focusing instead on chip design and IP architecture.
Are there chip ETFs that pay high dividends or income?
Covered-call ETFs like NVDY and FEPI are designed for income, generating high yields (25% to 60%) by selling options on semiconductor stocks, though they cap your potential for capital gains.