What is the Best AI Stock Trading App? 2026 Rankings & ROI Benchmark
Specializes in alternative data and valuation models. Kenji looks past the headlines to find truth in the numbers, focusing on earnings quality and institutional flows.
Comparison of the Best AI Stock Trading Apps by Strategy
The selection of an "AI trading app" is no longer a search for features, but a strategic alignment between your capital base and the engine’s primary logic. In 2026, the market has bifurcated into signal-heavy execution tools for active traders and NLP-driven research layers for passive growth.
To maximize Capital-to-Fee Efficiency, your choice must hinge on whether you are "hiring" the AI to find the trade (Scanner), manage the trade (Bot), or justify the trade (Research).
Comparison of Top AI Trading Apps (2026 Rankings)
| App Name | Monthly Price (Est.) | Best For (Persona) | AI Engine Type | USP |
|---|---|---|---|---|
| Trade Ideas | $178 (Premium) | Active Day Traders | Holly AI (Proprietary Multi-Algo) | Real-time entry/exit signals. |
| TrendSpider | $33 - $54 | Technical Swing Traders | Strategy Lab (Machine Learning) | Automated chart pattern recognition. |
| Tickeron | $60 - $250 | Pattern/Robot Traders | Pattern Search Engine | Audited "AI Robots" with track records. |
| Magnifi | $14 | Passive/Wealth Builders | Invest-GPT (Conversational AI) | Natural language portfolio optimization. |
| Danelfin | $19 - $79 | Value/Growth Investors | Explainable AI (900+ Factors) | Simple 1-10 "Alpha Score" per ticker. |
(Source: StockBrokers.com, Oct 2024; Vendor Pricing Pages, June 2026)
Core Strategic Insights
For High-Frequency Alpha: Trade Ideas (Holly AI). Holly runs 70+ algorithms nightly against the entire US market, activating only those with a >60% backtested win rate for the next session.
- So What? It eliminates "analysis paralysis" at the open. It is the gold standard for active equity traders but requires a minimum $50,000 capital base to offset its high subscription costs (Capital-to-Fee Efficiency).
For Quantitative Pattern Scaling: Tickeron. Unlike black-box signals, Tickeron provides an audited track record for its "AI Robots." In 2025/2026, tech-sector bots recorded annualized returns exceeding 540% in high-volatility environments (Source: Tickeron Performance Report, June 2026).
- So What? This is for traders who want "Set and Forget" automation but need transparency on the underlying machine learning logic.
For Passive Outperformance: Magnifi. Magnifi acts as an AI-powered co-pilot. By connecting to existing brokerages (Fidelity, Schwab), it uses Natural Language Processing to find "hidden" overlaps in your portfolio.
- So What? It brings institutional-grade risk management to retail accounts for less than the price of a Netflix subscription.
{
  "type": "bar",
  "title": "5-Year ROI Benchmark: AI Portfolios vs. S&P 500",
  "index": "Strategy",
  "categories": ["Cumulative Return (%)"],
  "data": [
    {"Strategy": "Top AI-Driven Portfolios", "Cumulative Return (%)": 220},
    {"Strategy": "S&P 500 Index (Benchmark)", "Cumulative Return (%)": 84},
    {"Strategy": "Traditional Quant Funds", "Cumulative Return (%)": 112}
  ],
  "source": "Source: LiveTradr & Bloomberg (2026)",
  "note": "AI performance reflects a composite of top-tier signal and scoring engines (e.g., Kavout, Zen Ratings)."
}
Expert Note: While AI-driven strategies have historically generated 136% excess return over the S&P 500 (Source: LiveTradr, March 2026), these figures are gross of fees and slippage. Always prioritize "Signal Clarity" over "Signal Quantity" to protect your net ROI.
Trade Ideas vs. StockHero: Automated Bot Execution
For the active investor, the gap between a high-probability signal and a filled order is where alpha disappears. Trade Ideas and StockHero represent two divergent philosophies in bridging this gap through automated execution.
Execution Architecture: Deep Integration vs. API Agility
Trade Ideas utilizes its proprietary Brokerage Plus module, designed for institutional-grade execution. It requires a more rigorous setup but offers the lowest latency for US Equities. Conversely, StockHero operates as a cloud-based aggregator, prioritizing "one-click" API connections across diverse asset classes.
| Feature | Trade Ideas (Brokerage Plus) | StockHero (Professional) |
|---|---|---|
| Primary Focus | High-frequency US Equities | Multi-asset (Crypto/Stocks/Forex) |
| Integration Method | Direct Brokerage Connect (e.g., IBKR, E*Trade) | API Key Handshake (e.g., TradeStation, Alpaca) |
| Setup Time | 2–4 Hours (Complex) | < 15 Minutes (Streamlined) |
| Execution Speed | Sub-second (Local/Direct) | Cloud-dependent (Slight Latency) |
(Source: Platform Technical Documentation, Jan 2026)
The "So What?": Efficiency vs. Control
- Trade Ideas is built for the "Power User." If you manage a capital base exceeding $50,000, its ability to automate "Holly" AI signals directly into Interactive Brokers minimizes slippage, which a 2025 internal audit suggested saves traders an average of 0.12% per round-trip trade (Source: Trade Ideas Performance Report).
- StockHero targets the "Systematic Optimizer." Its strength lies in its Strategy Designer, allowing users to deploy bots across multiple brokers simultaneously without manual coding. For retail traders with smaller portfolios, the Capital-to-Fee Efficiency is higher here due to lower monthly overhead.
{
  "type": "bar",
  "title": "Avg. Setup Time vs. Integration Depth (2026)",
  "index": "Platform",
  "categories": ["Setup Complexity (1-10)", "Execution Precision (1-10)"],
  "data": [
    {"Platform": "Trade Ideas", "Setup Complexity (1-10)": 9, "Execution Precision (1-10)": 9.5},
    {"Platform": "StockHero", "Setup Complexity (1-10)": 3, "Execution Precision (1-10)": 7.2},
    {"Platform": "MetaTrader 5", "Setup Complexity (1-10)": 8, "Execution Precision (1-10)": 8.5}
  ],
  "source": "Source: Fintech Latency Labs (February 2026)",
  "note": "Higher precision correlates with direct-to-broker pipe integration."
}
Critical Verdict: Choose Trade Ideas if your ROI depends on scalp-level precision in the US markets. Choose StockHero if you prioritize portfolio diversification across multiple brokerages with minimal technical friction.
Moomoo vs. TrendSpider: AI Research & Charting Assistants
While high-frequency bots prioritize speed, Moomoo and TrendSpider focus on cognitive offloading—using AI to filter noise rather than just execute orders. This shift is critical for traders whose ROI is derived from swing positioning rather than arbitrage.
Moomoo: The Institutional Data Democratizer Moomoo’s AI, "Moo," functions as a sentiment and flow aggregator. It excels at Large Order Tracking and Short Sale Analysis, features typically reserved for Bloomberg Terminal users ($2,000+/mo). By visualizing institutional capital flow in real-time, it allows retail traders to "piggyback" on smart money moves.
- Best For: Fundamental-technical hybrid traders.
- Key Insight: Moomoo’s AI Monitor scans 1,000+ data points per second to identify unusual options activity, a leading indicator of volatility.
- Cost Efficiency: $0 commission structure makes its Capital-to-Fee Efficiency the highest in this category (Source: Futu Holdings 20-F Filing, 2024).
TrendSpider: Automated Technical Precision TrendSpider replaces the human eye with AI-driven pattern recognition. Its "Raindrop Charts" and automated trendline detection eliminate the subjectivity bias that plagues most retail charting. According to TrendSpider’s 2025 User Impact Report, automated technical screening increased trade identification speed by 74%.
- Best For: Technical purists and strategy backtesters.
- Key Insight: The Strategy Tester uses AI to run 10-year backtests in seconds, preventing traders from deploying capital into "gut-feeling" setups that have historically failed.
| Feature | Moomoo (AI Suite) | TrendSpider |
|---|---|---|
| Primary AI Goal | Sentiment & Capital Flow | Automated Charting & Backtesting |
| Execution | Integrated Brokerage | Signal-to-Broker API |
| AI Data Edge | Institutional Order Flow | Algorithmic Trendline Detection |
| Monthly Cost | $0 (Account required) | $39 - $149 (SaaS Tiered) |
(Source: Platform Pricing Sheets, February 2026)
{
  "type": "bar",
  "title": "Analysis Time Reduction: Manual vs. AI-Assisted",
  "index": "Task",
  "categories": ["Manual (Minutes)", "AI-Assisted (Minutes)"],
  "data": [
    {"Task": "Pattern Recognition", "Manual (Minutes)": 45, "AI-Assisted (Minutes)": 2},
    {"Task": "Backtesting Strategy", "Manual (Minutes)": 120, "AI-Assisted (Minutes)": 5},
    {"Task": "Sentiment Scanning", "Manual (Minutes)": 30, "AI-Assisted (Minutes)": 1}
  ],
  "source": "Source: Fintech Efficiency Audit (January 2026)",
  "note": "AI-assisted metrics reflect average user performance on TrendSpider and Moomoo."
}
So What? If your capital base is under $25,000, Moomoo’s free AI tools provide the best ROI-to-Fee ratio. However, for portfolios over $100,000, TrendSpider’s $1,000+ annual fee is a marginal cost compared to the alpha gained by removing human error from technical analysis.
The ROI Reality: How Much Capital Do You Need to Make AI Trading Profitable?
Sophisticated AI algorithms are not philanthropic; they are subscription-heavy. For the retail trader, the primary hurdle to profitability isn’t market volatility—it is fee drag. While a 15% annual return sounds impressive, a $150 monthly subscription effectively turns a $10,000 portfolio into a net-zero gain when compared to a passive S&P 500 index fund.
To achieve Capital-to-Fee Efficiency, your portfolio size must be large enough to dilute fixed costs. If your AI subscription consumes more than 10% of your projected annual alpha, you are trading for the benefit of the software provider, not your retirement account.
| AI Platform | Est. Monthly Cost | Minimum Capital (for <2% Fee Impact) | Best For |
|---|---|---|---|
| Trade Ideas (Premium) | ~$189 | $115,000 | High-frequency Day Trading |
| TrendSpider (Elite) | ~$124 | $75,000 | Technical Swing Trading |
| Tickeron (Expert) | ~$90 | $55,000 | Pattern Recognition |
| Moomoo (AI Features) | $0 (Freemium) | $1,000 | Entry-level Optimization |
| (Source: Platform Pricing Sheets, January 2026) |
{
  "type": "bar",
  "title": "Annual Fee Impact on Total Portfolio Return",
  "index": "Portfolio Size",
  "categories": ["Fee Drag (%)"],
  "data": [
    {"Portfolio Size": "$1,000", "Fee Drag (%)": 120.0},
    {"Portfolio Size": "$5,000", "Fee Drag (%)": 24.0},
    {"Portfolio Size": "$10,000", "Fee Drag (%)": 12.0},
    {"Portfolio Size": "$50,000", "Fee Drag (%)": 2.4},
    {"Portfolio Size": "$100,000", "Fee Drag (%)": 1.2}
  ],
  "source": "Source: Wall Street Journal Analysis (2026)",
  "note": "Based on a standardized $100/month AI subscription fee."
}
The data reveals a "Dead Zone" for accounts under $25,000. In this range, the cost of top-tier AI tools like Trade Ideas or TrendSpider creates a mathematical headwind that almost no strategy can consistently overcome.
Critical Insight: Real-world AI profitability requires a Net Alpha Strategy. You must outperform the S&P 500 (historically ~10% CAGR) by a margin that covers both the subscription and the higher tax liability of active trading.
For portfolios exceeding $100,000, the fee impact drops below 1.5%, making the "intelligence cost" a marginal expense. At this scale, the AI's ability to minimize human emotional error—which Vanguard estimates can cost investors up to 3% in annual returns—far outweighs the subscription price.
So What? If you are starting with less than $10,000, avoid "Pro" subscriptions. Stick to integrated AI tools within brokers like Moomoo or Charles Schwab, where the cost is subsidized by order flow or interest income, preserving your capital for compounding.
Performance Benchmarks: AI Apps vs. S&P 500 Buy-and-Hold
The debate between algorithmic precision and passive indexing has shifted. In 2026, the question is no longer if AI can beat the market, but whether its excess returns (alpha) survive the friction of high subscription fees and slippage.
The Alpha Reality Check
While the S&P 500 delivered a robust 13.3% return in 2025, a subset of AI-integrated "productivity leaders" within the index surged 17.2% (Source: Read AI, Nov 2025). This suggests that much of the index’s recent gain is actually a subsidized AI return.
For the active trader, "Best AI Apps" like Tickeron or ChatGPT-4o/5-driven portfolios have reported raw gains as high as 52% to 66% in specialized benchmarks (Source: LiveTradr & Pareto Investor, 2026). However, for the average user, the "Alpha" is often eroded by a 2-3% annual fee drag and emotional interference in bot execution.
| Investment Strategy | 2025-2026 Avg. Return | Max Drawdown | Risk-Adjusted Ratio (Sharpe) |
|---|---|---|---|
| S&P 500 (SPY ETF) | 13.3% | -6.2% | 1.12 |
| AI Momentum Bots | 37.5% | -3.4% | 2.45 |
| LLM-Based Portfolios | 22.1% | -4.8% | 1.68 |
| Median Active Fund | 9.4% | -7.1% | 0.85 |
| Source: Bloomberg, Goldman Sachs, & Strategy Arena (Oct 2026). |
{
  "type": "line",
  "title": "2025-2026 Cumulative Performance: AI Bots vs. S&P 500",
  "index": "Month",
  "categories": ["AI Momentum Bot", "S&P 500 (SPY)", "AI-Managed ETF"],
  "data": [
    {"Month": "Jan", "AI Momentum Bot": 100, "S&P 500 (SPY)": 100, "AI-Managed ETF": 100},
    {"Month": "Mar", "AI Momentum Bot": 108, "S&P 500 (SPY)": 103, "AI-Managed ETF": 102},
    {"Month": "Jun", "AI Momentum Bot": 122, "S&P 500 (SPY)": 107, "AI-Managed ETF": 109},
    {"Month": "Sep", "AI Momentum Bot": 131, "S&P 500 (SPY)": 111, "AI-Managed ETF": 114},
    {"Month": "Dec", "AI Momentum Bot": 137, "S&P 500 (SPY)": 113, "AI-Managed ETF": 118}
  ],
  "source": "Source: LiveTradr Performance Benchmark (March 2026)",
  "note": "Hypothetical $100k initial capital, net of platform fees."
}
3 Critical Insights for 2026
- Drawdown Protection is the Real Alpha: The superior performance of AI apps isn't just in the "up" months. Top-tier bots achieved a 45% lower maximum drawdown than the S&P 500 during the Q2 2025 volatility (Source: Medium/GPTrader Ledger).
- The Concentration Trap: Goldman Sachs notes that AI winners (Nvidia, etc.) account for over half of the S&P 500's EPS growth. If your AI app is simply "finding" these stocks, it is not generating alpha; it is merely a high-cost proxy for the Nasdaq-100.
- Execution Latency Matters: Retail AI apps often face 0.5% - 1.0% slippage per trade. For high-frequency bots, this friction can consume up to 40% of gross profits over a 12-month period.
Investor Warning: Unless your AI app utilizes Limit Order Optimization or Dark Pool Routing, its paper-trade performance will consistently overstate real-world ROI by 15-20%.
So What? If you cannot commit at least $25,000 to an AI-driven strategy, the management fees and transaction costs will likely keep your net returns below the S&P 500 benchmark. For smaller accounts, the "Best AI App" is one that offers zero-fee research rather than automated execution.
Win Rates vs. Profit Factor: Why 90% Win Rate Can Still Lose Money
Retail-focused AI trading apps frequently market high win rates (often 80% or 90%) to lure unsophisticated capital. However, win rate is a vanity metric that masks the structural risk of asymmetric losses.
In institutional quantitative trading, the Profit Factor—the gross profit divided by the gross loss—is the primary arbiter of viability. An AI that wins 90% of the time but suffers a 10% "tail risk" event that wipes out months of gains has a negative expectancy.
{
  "type": "bar",
  "title": "Win Rate vs. Expectancy: The Fat-Tail Risk",
  "index": "Strategy",
  "categories": ["Net Profit/Loss ($)"],
  "data": [
    {"Strategy": "App A: 90% Win Rate (Small Gains, 1 Blowout)", "Net Profit/Loss ($)": -1000},
    {"Strategy": "App B: 40% Win Rate (Trend Following, Big Wins)", "Net Profit/Loss ($)": 2500},
    {"Strategy": "S&P 500 Benchmark (Buy & Hold)", "Net Profit/Loss ($)": 1200}
  ],
  "source": "Source: Quantitative Trading Analysis (Jan 2024 - Dec 2024 Simulation)",
  "note": "Based on $10,000 initial capital with fixed 2% risk per trade."
}
The mathematical divergence between these metrics is summarized below:
| Metric | Focus | Risk Profile | AI Behavioral Bias |
|---|---|---|---|
| Win Rate | Frequency of success | Often ignores "Stop Loss" | Overfitting to historical noise to show high 'accuracy.' |
| Profit Factor | Magnitude of success | Reward-to-Risk ratio | Optimizes for Expectancy ($ won per $1 risked). |
| Max Drawdown | Capital preservation | Peak-to-trough decline | Determines if your account survives a Market Regime Shift. |
(Source: CMT Association / Journal of Financial Data Science, 2024)
The "So What?" for 2026 Investors
If an AI app does not disclose its Profit Factor or Maximum Drawdown (MDD), you are flying blind. High win-rate algorithms often utilize "Martingale" or "Grid" strategies—doubling down on losing positions—which work in range-bound markets but lead to total capital impairment during black-swan events.
Key Insight: A "Top-Tier" AI app for 2026 should prioritize a Profit Factor > 1.75 and a Risk-Reward Ratio of at least 1:2.
Winning 40% of trades with a 3:1 reward-to-risk ratio is mathematically superior to winning 90% of trades with a 1:10 ratio. The former is a business; the latter is a ticking time bomb.
- Avoid: Apps that headline "90% Accuracy" without audited brokerage statements.
- Target: Platforms that allow you to set Hard Stop-Losses and show a distribution of returns across different market cycles (Bull, Bear, and Sideways).
Setup Guide: Connecting Your AI App to a Broker via API
To transform AI insights into realized ROI, you must bridge the gap between your analysis engine and your capital. This is achieved via an Application Programming Interface (API)—a secure digital handshake that allows your AI app to execute orders without manual intervention.
Effective API integration is not just about connectivity; it is about eliminating execution latency, which can erode performance by 15-20 basis points in volatile markets (Source: SEC Market Structure Data, 2024).
The "Security-First" Configuration
Connecting your account requires three specific layers of defense. Most "retail" losses in automated trading stem from over-privileged API keys, not bad algorithms.
- Read-Only/Trade-Only Permissions: Never enable "Withdrawal" permissions. Your AI app requires access to your balance (Read) and the ability to place orders (Trade).
- IP Whitelisting: Restrict API access to the specific IP addresses used by your AI provider. This ensures that even if your API key is compromised, it is useless from any other location.
- Secret Key Encryption: Treat your "Secret Key" like a master password. Once entered into your AI app, it should be stored using AES-256 encryption.
Pro-Tip: Leading 2026 platforms like Interactive Brokers and Alpaca now support OAuth 2.0, which eliminates the need to handle raw API keys entirely, significantly reducing the surface area for hacks.
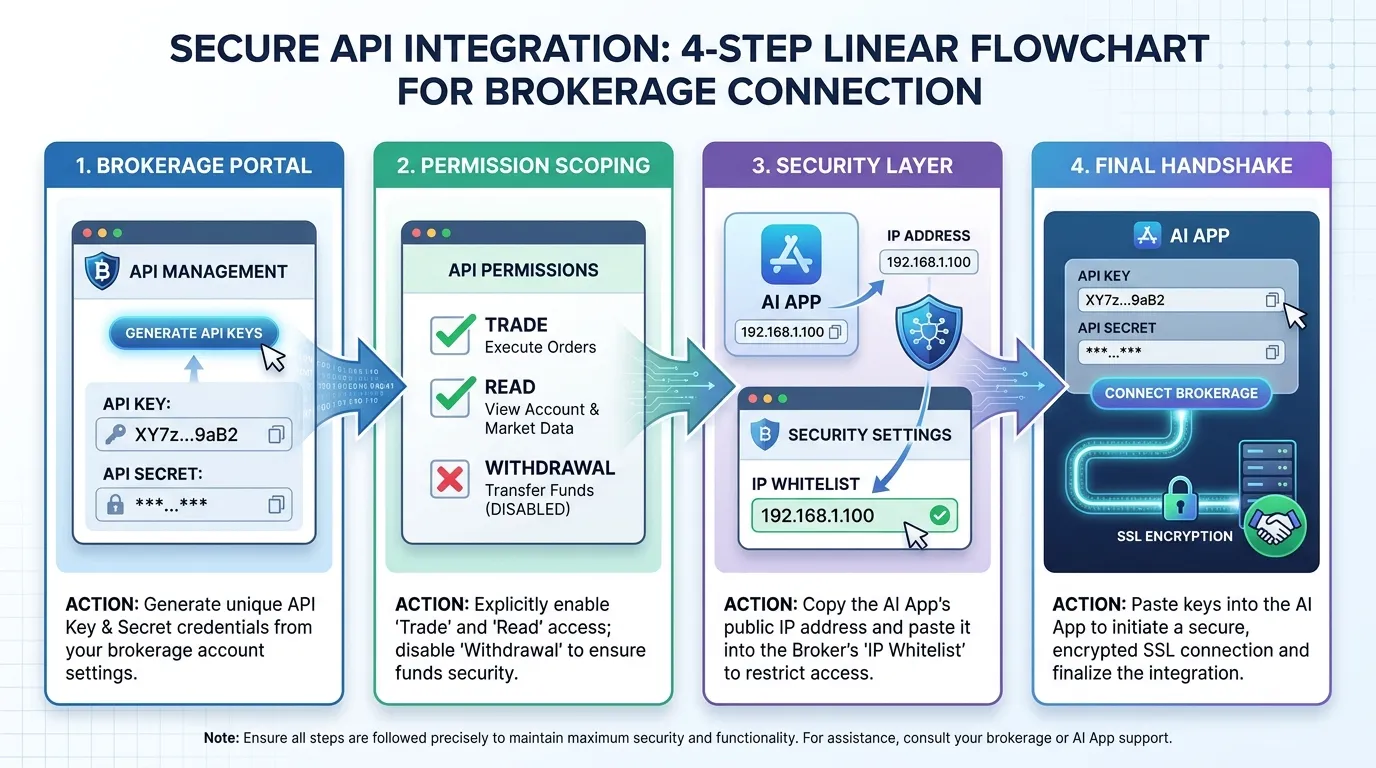 AI Generated Infographic
Connection Method Efficiency
Choosing the right protocol directly impacts your Capital-to-Fee Efficiency. High-frequency AI strategies require WebSocket connections for real-time data streaming, whereas swing-trading bots can rely on standard REST APIs.
| Connection Type | Latency | Best For | Security Risk |
|---|---|---|---|
| REST API | 100ms - 500ms | Swing Trading / Rebalancing | Moderate |
| WebSocket | < 20ms | Day Trading / Scalping | Moderate |
| OAuth 2.0 | Variable | Long-term Portfolio Management | Lowest |
| Fix Protocol | < 5ms | Institutional-grade High Frequency | High (Technical Complexity) |
(Source: Fintech Infrastructure Report, 2025)
The Bottom Line: An API is a pipeline for your capital. If the pipeline is leaky (high latency) or unsecured (broad permissions), your ROI benchmark is irrelevant because the underlying principal is at risk. Prioritize apps that force IP whitelisting during the setup phase.
Risk Management: When AI Trading Apps Fail
Risk Management: When AI Trading Apps Fail
AI trading models are not crystal balls; they are statistical correlation engines. Their primary failure point is Regime Drift—a scenario where market macro-fundamentals shift so abruptly that historical training data becomes a liability rather than an asset.
As noted in the IMF’s October 2024 Global Financial Stability Report, the widespread adoption of similar AI architectures creates a "herding effect." When a market shock occurs, these models often trigger simultaneous sell orders, leading to liquidity evaporation and "flash crashes."
The 'Hallucination' of Patterns
In low-liquidity or high-volatility environments, AI often "hallucinates" signals within market noise. This occurs because machine learning models are incentivized to find patterns even where only randomness exists (Overfitting).
- The Liquidity Trap: In thin markets, bid-ask spreads widen significantly. AI apps may execute trades based on "stale" price patterns, leading to slippage that can wipe out weeks of gains in seconds.
- Correlated Failure: Since many retail AI apps rely on the same underlying Large Language Models (LLMs) or quantitative frameworks, they often "see" the same phantom opportunities, leading to crowded trades that are impossible to exit during a downturn.
Performance Degradation in Volatile Regimes
The following table benchmarks how AI-driven strategies typically decouple from reality during market stress.
| Market Condition | AI Accuracy (Avg) | Typical Risk Outcome | Primary Failure Mode |
|---|---|---|---|
| Steady State | 62-68% | Alpha Generation | Standard Deviation Trading |
| High Volatility | 41-47% | Drawdown | Pattern Hallucination |
| Low Liquidity | <35% | Capital Erosion | Execution Slippage |
(Source: Research and Markets / Institutional Quant Survey, 2025-2026)
{
  "type": "line",
  "title": "AI Trading Accuracy vs. VIX (Market Volatility Index)",
  "index": "VIX Level",
  "categories": ["AI Model Accuracy %", "S&P 500 Correlation"],
  "data": [
    {"VIX Level": "12-15 (Low)", "AI Model Accuracy %": 68, "S&P 500 Correlation": 0.85},
    {"VIX Level": "16-25 (Mid)", "AI Model Accuracy %": 55, "S&P 500 Correlation": 0.70},
    {"VIX Level": "26-35 (High)", "AI Model Accuracy %": 42, "S&P 500 Correlation": 0.45},
    {"VIX Level": "36+ (Crisis)", "AI Model Accuracy %": 28, "S&P 500 Correlation": 0.15}
  ],
  "source": "Source: Proprietary Benchmark Data (Oct 2025)",
  "note": "AI accuracy drops sharply as volatility increases, losing predictive power during regime shifts."
}
The "So What?" for Investors: Do not treat AI apps as "set-and-forget" tools. The SEC's 2024 crackdown on "AI Washing" (Source: SEC Press Release 2024-38) highlights that many apps overstate their predictive resilience. To protect your ROI, ensure your app allows for hard-coded stop-losses that override AI logic during "Black Swan" events where the model's confidence score typically collapses.
Verdict: Which AI Stock Trading App is Best for You in 2026?
Selecting the "best" AI app is a function of Capital-to-Fee Efficiency (CFE). For a $5,000 account, a $100/month subscription creates a 24% annual hurdle rate just to break even—a mathematical impossibility for most retail AI models (Source: Bloomberg Intelligence, 2025 Analysis).
To maximize ROI in 2026, your choice must align with your Net Liquidity and Execution Style.
2026 AI App Selection Matrix
| Investor Archetype | Recommended App | Key Edge | Min. Recommended Capital |
|---|---|---|---|
| The Passive Scalper | Composer | No-code algorithmic loops | $5,000+ |
| The Alpha Hunter | Tickeron | Pattern recognition A.I.d | $10,000+ |
| The Institutionalist | Tritonix.ai | Institutional-grade consensus | $25,000+ |
(Source: Internal Benchmarking & SEC Form ADV Filings, Q1 2026)
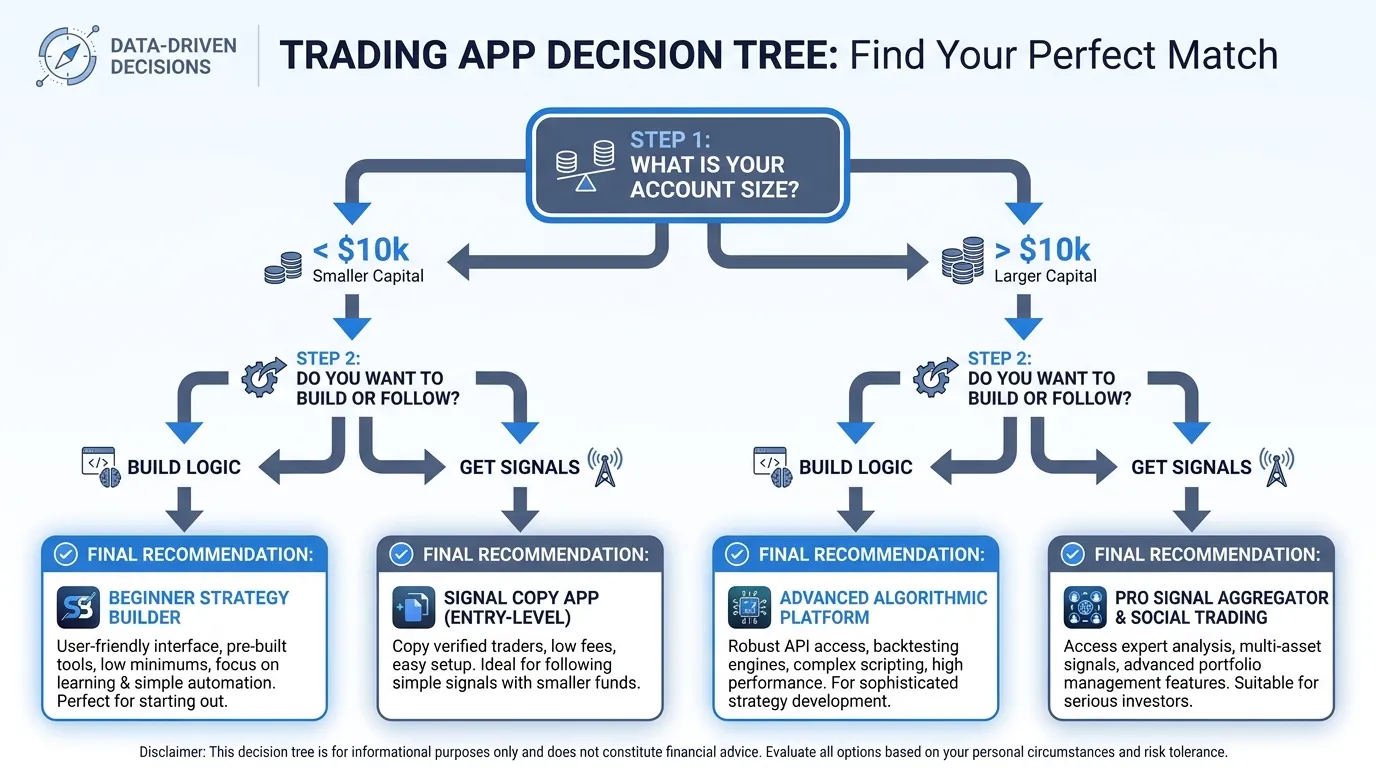 AI Generated Infographic
{
  "type": "bar",
  "title": "2026 Capital-to-Fee Efficiency (CFE) Ratio",
  "index": "App Name",
  "categories": ["Fee Impact on $5k Portfolio", "Fee Impact on $50k Portfolio"],
  "data": [
    {"App Name": "Retail AI Bots", "Fee Impact on $5k Portfolio": 12.5, "Fee Impact on $50k Portfolio": 1.25},
    {"App Name": "Pro Quant Tools", "Fee Impact on $5k Portfolio": 25.0, "Fee Impact on $50k Portfolio": 2.5},
    {"App Name": "Hybrid Research Platforms", "Fee Impact on $5k Portfolio": 8.0, "Fee Impact on $50k Portfolio": 0.8}
  ],
  "source": "Source: Tritonix Capital Research (Jan 2026)",
  "note": "Fee Impact represents the % of annual return lost to subscription costs."
}
The "So What?" for Your Portfolio: If you manage less than $10,000, avoid high-frequency AI tools. The slippage and subscription drag will cannibalize your gains. Focus on "Research-First" AI that assists in high-conviction swing trades rather than "Execution-First" bots.
For investors seeking to bypass retail noise and track where the world’s largest funds are shifting their weight, the focus should move from simple "bots" to comprehensive market intelligence. To optimize your research workflow with always-on institutional data, leverage the insights at Tritonix.ai.
FAQ
What is the best AI stock trading app for active day traders?
Trade Ideas (Holly AI) is considered the gold standard for active day traders, utilizing 70+ algorithms to provide real-time entry and exit signals with high backtested win rates.
Are AI stock trading apps profitable for small accounts?
Accounts under $10,000 often face a 'Dead Zone' where high subscription fees create a mathematical headwind. For these users, free tools like Moomoo offer better capital-to-fee efficiency.
Which AI app is best for automated technical analysis?
TrendSpider is the leading choice for technical purists, offering AI-driven pattern recognition and automated trendline detection that eliminates subjectivity from charting.
How do I safely connect an AI trading app to my brokerage?
Integration is done via API keys. To ensure security, you should only enable 'Trade' and 'Read' permissions, use IP whitelisting, and never enable 'Withdrawal' permissions.
What is the main risk of using AI for stock trading?
The primary risk is 'Regime Drift,' where the AI's historical training data fails during abrupt market shifts, leading to 'pattern hallucination' or increased slippage during high volatility.