AI Stocks After the November Shakeout: Infrastructure, Platforms, and the Capex Test
PhD in Electrical Engineering. Formerly a silicon architect in Silicon Valley. She deconstructs complex tech stacks—from AI chips to autonomous driving sensors—into investable insights.
What “AI stocks” actually means in late 2026
“AI stocks” is the search investors use when they want the public companies that design, manufacture, power, host, or apply large-scale artificial intelligence. It is not a single ticker, and the November tape made that distinction expensive to ignore.
The useful way to sort the group is by where cash is earned in the stack. At the base are the infrastructure names: foundries, memory suppliers, and accelerator vendors such as Taiwan Semiconductor Manufacturing (NYSE: TSM), Micron Technology (NASDAQ: MU), NVIDIA (NASDAQ: NVDA), Broadcom (NASDAQ: AVGO), and Advanced Micro Devices (NASDAQ: AMD). In the middle are the cloud platforms that convert that hardware into contracted compute: Microsoft (NASDAQ: MSFT), Alphabet (NASDAQ: GOOGL), Amazon (NASDAQ: AMZN), Meta Platforms (NASDAQ: META), and Oracle (NYSE: ORCL). At the top sit the application and agentic software companies that try to turn model access into product revenue; Palantir Technologies (NASDAQ: PLTR) is the clearest large-cap example.
U.S. cash markets were closed on Saturday, November 14, and Sunday, November 15, 2026. The latest official prices are Friday’s New York closes, not weekend prints or after-hours flickers. Those Friday quotes arrived four sessions before NVIDIA reports fiscal third-quarter results, and three sessions after the company said its board had accepted Jensen Huang’s resignation and appointed CFO Colette Kress as interim chief executive.
The spending backdrop is still enormous. J.P. Morgan Global Research projects about $900 billion of AI capital expenditure in 2026, revised up from $736 billion, and a cumulative $5.5 trillion by 2030. The five U.S. hyperscalers — Amazon, Alphabet, Meta, Oracle, and Microsoft — are, in that analysis, on track to spend roughly as much this year as they have spent in total since ChatGPT launched in November 2022. The investment question is no longer whether the buildout is large. It is which AI stocks collect cash from that spending, and which ones must fund it.
AI stocks are a stack, not a sector. In November 2026 the infrastructure suppliers are still converting demand into free cash flow, while several platforms are paying for the plants, racks, and power — and the market is starting to price that split.
The November 13 tape: a three-speed market
The official session was messy, not collapsed. The S&P 500 closed at 7,561.67, down 30.73, or 0.40%, from 7,592.40. The Nasdaq Composite finished at 25,136.27, down 229.83, or 0.91%, from 25,366.10. Inside the AI complex, Friday’s moves and the 52-week record told very different stories.
| Ticker | Nov. 13 close | Day change | Market cap | 52-week range | 52-week change |
|---|---|---|---|---|---|
| NVDA | $162.85 | −2.01% | $3.93T | $148.80–$243.37 | −15.97% |
| MSFT | $523.88 | +0.17% | $3.89T | $349.20–$559.15 | +2.49% |
| GOOGL | $295.77 | −0.98% | $3.64T | $270.70–$408.61 | +3.16% |
| AMZN | $266.66 | −0.29% | $2.88T | $196.00–$287.20 | +9.20% |
| TSM | $398.73 | −1.67% | $1.85T | $266.82–$487.47 | +37.20% |
| AVGO | $347.01 | −4.76% | $1.66T | $289.77–$495.00 | −2.31% |
| META | $641.69 | +2.90% | $1.64T | $520.26–$779.82 | +5.37% |
| MU | $778.31 | −2.52% | $880.60B | $192.59–$1,255.00 | +217.81% |
| AMD | $534.06 | −8.75% | $875.90B | $188.22–$658.52 | +106.29% |
| PLTR | $167.99 | −2.09% | $404.77B | $106.37–$212.94 | −8.79% |
| ORCL | $125.35 | −1.38% | $390.80B | $109.21–$250.25 | −44.78% |
Source: StockAnalysis quote and statistics pages for each ticker, official close of November 13, 2026; index closes from Yahoo Finance.
{
  "type": "bar",
  "title": "52-Week Price Change for Major AI Stocks at the November 13, 2026 Close",
  "index": "Ticker",
  "categories": ["52-Week Change (%)"],
  "data": [
    {"Ticker": "MU", "52-Week Change (%)": 217.81},
    {"Ticker": "AMD", "52-Week Change (%)": 106.29},
    {"Ticker": "TSM", "52-Week Change (%)": 37.20},
    {"Ticker": "AMZN", "52-Week Change (%)": 9.20},
    {"Ticker": "META", "52-Week Change (%)": 5.37},
    {"Ticker": "GOOGL", "52-Week Change (%)": 3.16},
    {"Ticker": "MSFT", "52-Week Change (%)": 2.49},
    {"Ticker": "AVGO", "52-Week Change (%)": -2.31},
    {"Ticker": "PLTR", "52-Week Change (%)": -8.79},
    {"Ticker": "NVDA", "52-Week Change (%)": -15.97},
    {"Ticker": "ORCL", "52-Week Change (%)": -44.78}
  ],
  "source": "StockAnalysis statistics pages, 52-week price change as of the November 13, 2026 official close",
  "note": "Percentage changes are price returns over the prior 52 weeks, not year-to-date returns."
}
The leaders of the last year and the leaders of Friday were not the same set. Micron is still up 217.81% over 52 weeks on trailing revenue growth of 256.3%, but the shares are 38.0% below the $1,255.00 52-week high and sit under the $943.78 50-day average. AMD, up 106.29% over 52 weeks, dropped 8.75% on Friday to $534.06, an 18.9% retreat from its $658.52 high. NVIDIA closed at $162.85, 33.1% below the $243.37 high printed on October 6 and 15.97% lower over 52 weeks, with a 14-day RSI of 24.86.
The platforms were calmer, and more split. Microsoft finished at $523.88, only 6.3% below its $559.15 high, and is still above both its 50-day average of $519.00 and its 200-day average of $441.42. Amazon, at $266.66, is 7.2% below its high and also above both moving averages. Alphabet, by contrast, has a 52-week gain of just 3.16% and is 27.6% below its $408.61 high, with the $328.19 50-day and $338.48 200-day averages both overhead. Oracle remains the cleanest derating in the group: $125.35, down 44.78% over 52 weeks and almost 50% below the $250.25 high.
A 52-week winner, a 52-week loser, and a stock sitting near its highs can all be “AI stocks.” The label no longer tells you what you own.
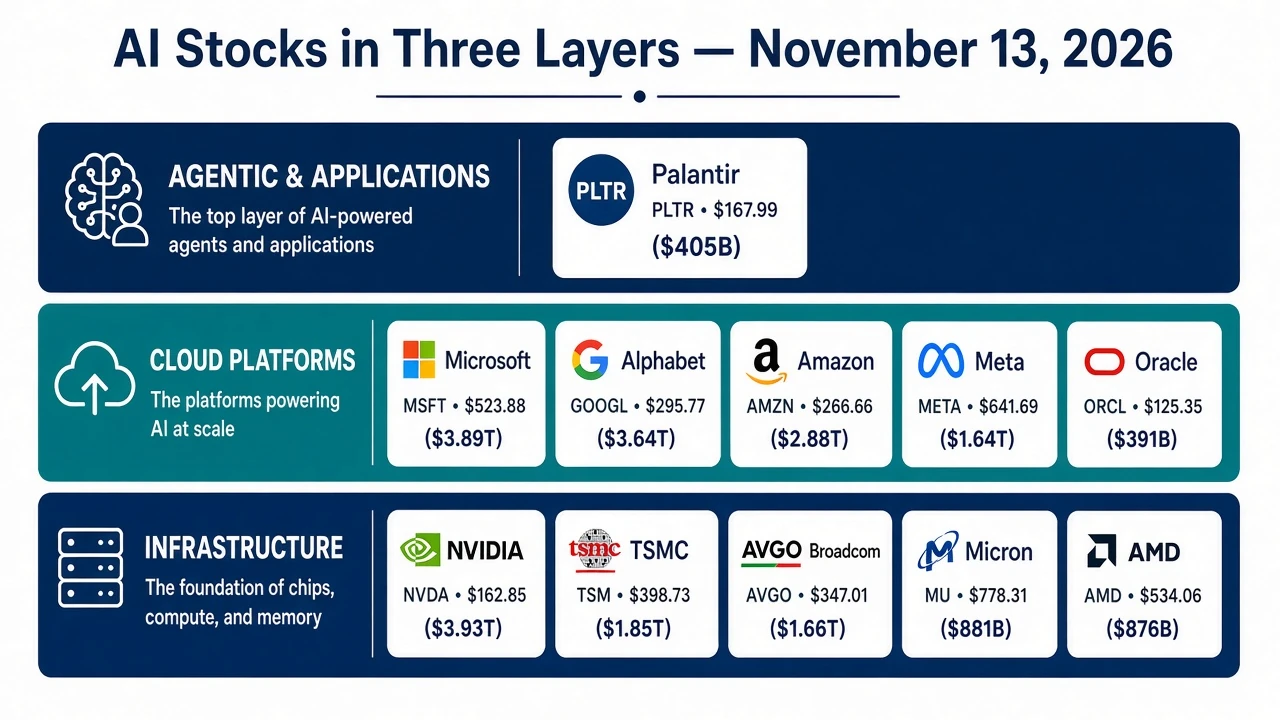
The AI stock universe at the November 13, 2026 close, grouped by infrastructure, cloud platforms, and agentic applications. Prices and market caps from StockAnalysis.
The capex conversion test that now splits the group
J.P. Morgan’s $900 billion 2026 capex figure is a demand story for chipmakers and a cash-flow story for the buyers. The trailing-twelve-month accounts already show that split with unusual clarity.
| Company | TTM revenue | TTM capex | TTM free cash flow | FCF margin | FCF / capex |
|---|---|---|---|---|---|
| NVIDIA | $303.0B | $7.35B | $127.01B | 41.92% | 17.3x |
| Broadcom | $89.10B | $1.25B | $39.40B | 44.22% | 31.5x |
| Micron | $133.19B | $30.71B | $58.96B | 44.27% | 1.9x |
| TSMC | $155.16B | $50.07B | $45.02B | 29.95% | 0.90x |
| Palantir | $7.29B | $43.2M | $4.05B | 55.62% | 93.7x |
| AMD | $45.44B | $2.07B | $7.06B | 15.53% | 3.4x |
| Microsoft | $346.45B | $135.92B | $59.96B | 17.31% | 0.44x |
| Meta | $241.61B | $104.44B | $28.65B | 11.86% | 0.27x |
| Alphabet | $471.10B | $159.80B | $19.75B | 4.19% | 0.12x |
| Oracle | $71.78B | $75.66B | −$28.72B | n/a | n/a |
| Amazon | $797.46B | $215.19B | −$46.89B | n/a | n/a |
Source: StockAnalysis cash-flow and income-statement statistics as of the November 13, 2026 close. Free cash flow is operating cash flow minus capital expenditures. Palantir capex is $43.24 million.
{
  "type": "bar",
  "title": "Trailing-Twelve-Month Capex vs. Free Cash Flow for Major AI Stocks",
  "index": "Company",
  "categories": ["Capex ($B)", "Free Cash Flow ($B)"],
  "data": [
    {"Company": "NVIDIA", "Capex ($B)": 7.35, "Free Cash Flow ($B)": 127.01},
    {"Company": "Broadcom", "Capex ($B)": 1.25, "Free Cash Flow ($B)": 39.40},
    {"Company": "Micron", "Capex ($B)": 30.71, "Free Cash Flow ($B)": 58.96},
    {"Company": "TSMC", "Capex ($B)": 50.07, "Free Cash Flow ($B)": 45.02},
    {"Company": "AMD", "Capex ($B)": 2.07, "Free Cash Flow ($B)": 7.06},
    {"Company": "Palantir", "Capex ($B)": 0.04, "Free Cash Flow ($B)": 4.05},
    {"Company": "Microsoft", "Capex ($B)": 135.92, "Free Cash Flow ($B)": 59.96},
    {"Company": "Meta", "Capex ($B)": 104.44, "Free Cash Flow ($B)": 28.65},
    {"Company": "Alphabet", "Capex ($B)": 159.80, "Free Cash Flow ($B)": 19.75},
    {"Company": "Oracle", "Capex ($B)": 75.66, "Free Cash Flow ($B)": -28.72},
    {"Company": "Amazon", "Capex ($B)": 215.19, "Free Cash Flow ($B)": -46.89}
  ],
  "source": "StockAnalysis cash-flow statistics as of the November 13, 2026 close",
  "note": "Figures are trailing twelve months. Palantir capex is $43.24 million, shown as 0.04."
}
NVIDIA spent only $7.35 billion on capital expenditures over the past year and generated $127.01 billion of free cash flow, a 41.92% FCF margin, on $302.97 billion of revenue and a 65.21% operating margin. Broadcom is even more asset-light: $1.25 billion of capex and $39.40 billion of free cash flow, a 44.22% FCF margin, on revenue that is up 48.7%. Micron had to reinvest — capex was $30.71 billion — but still produced $58.96 billion of free cash flow and a 74.59% operating margin after a memory upcycle that lifted trailing revenue 256.3% and net income 895.1%. TSMC, the foundry gatekeeper, spent $50.07 billion and converted it into $45.02 billion of free cash flow, a 29.95% margin that still funds a dividend of $4.49, or 1.13%.
The platforms look different. Amazon’s trailing capex of $215.19 billion exceeded its $168.30 billion of operating cash flow, leaving free cash flow at −$46.89 billion. Oracle spent $75.66 billion, more than its $71.78 billion of trailing revenue, and posted free cash flow of −$28.72 billion with a debt-to-equity ratio of 2.52. Alphabet spent $159.80 billion and retained only $19.75 billion of free cash flow, an FCF margin of 4.19%. Microsoft remains the most balanced of the large spenders: capex of $135.92 billion, free cash flow still positive at $59.96 billion, and an FCF margin of 17.31%. In its fiscal 2027 first quarter, reported on October 28, 2026, Microsoft Cloud revenue was $63.9 billion, up 30%, Azure revenue rose 48%, and commercial remaining performance obligation increased 73% to $677 billion.
Palantir is the other side of the same coin. Trailing revenue is only $7.29 billion, but capex is a rounding error at $43.24 million, free cash flow is $4.05 billion, and the FCF margin is 55.62%. That is what an agentic software model looks like when it works: almost no plant, a lot of cash, and a valuation that has to do all of the work.
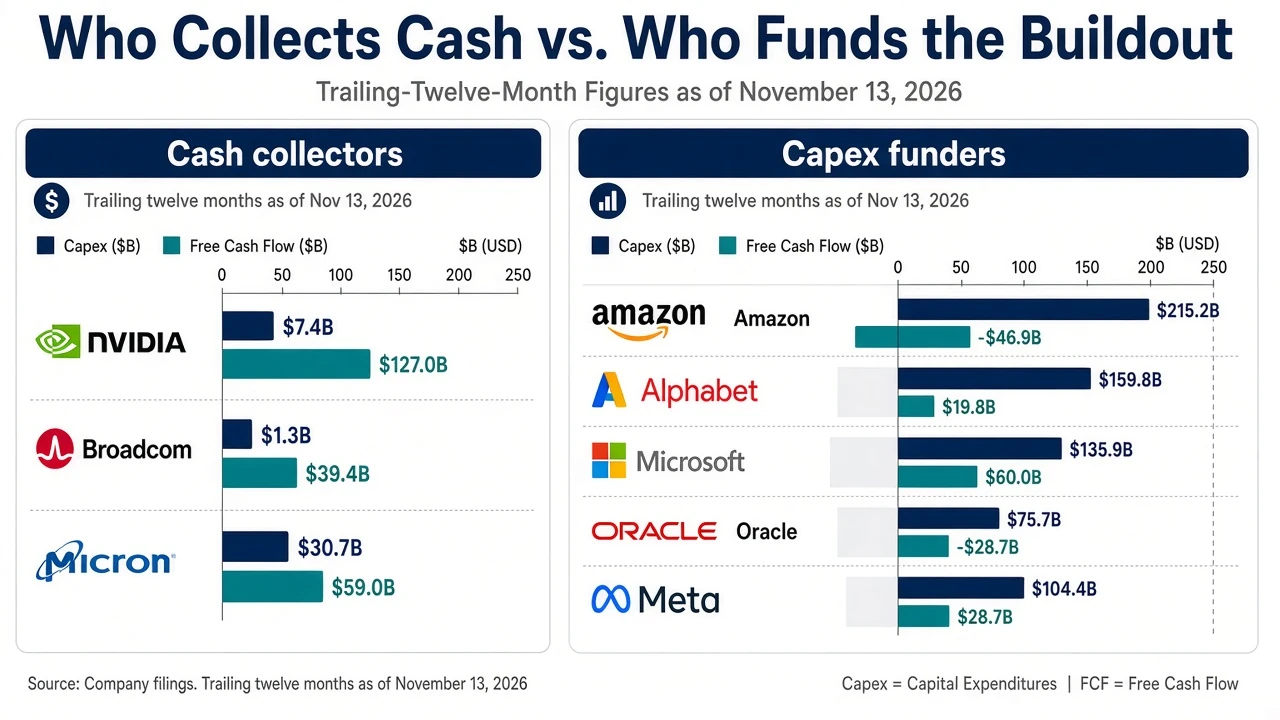
Trailing-twelve-month capital expenditure versus free cash flow for major AI stocks, as of the November 13, 2026 close. Figures from StockAnalysis.
If the $900 billion capex wave continues, the suppliers can keep compounding cash. If it slows, the first pain is at the companies that have already borrowed or sacrificed free cash flow to build ahead of demand.
Valuation: cheap earnings can still be expensive cash
The same split shows up in the multiples, which is why a single “is there an AI bubble?” question is the wrong one. Some of these stocks are inexpensive on earnings and still demanding on cash. Others are expensive on every conventional screen.
| Company | Trailing P/E | Forward P/E | PEG | Price / sales | Price / FCF | Inst. ownership |
|---|---|---|---|---|---|---|
| Micron | 10.47 | 4.41 | 0.08 | 6.61 | 14.93 | 79.55% |
| Alphabet | 15.44 | 21.45 | 1.64 | 7.72 | 184.14 | 66.03% |
| Oracle | 19.65 | 14.68 | 0.50 | 5.44 | n/a | 43.40% |
| NVIDIA | 20.59 | 13.46 | 0.27 | 12.98 | 30.96 | 70.68% |
| Amazon | 21.55 | 26.97 | 1.14 | 3.62 | n/a | 68.36% |
| Meta | 21.88 | 19.48 | 1.01 | 6.79 | 57.26 | 68.36% |
| TSMC | 26.91 | 19.04 | n/a | 11.93 | 41.13 | 48.68% |
| Microsoft | 27.35 | 25.24 | 1.54 | 11.23 | 64.89 | 75.80% |
| Broadcom | 44.29 | 19.94 | 0.36 | 18.59 | 42.04 | 79.66% |
| AMD | 115.76 | 35.48 | 0.51 | 19.28 | 124.14 | 75.34% |
| Palantir | 118.34 | 73.10 | 1.25 | 55.54 | 99.85 | 62.60% |
Source: StockAnalysis valuation and ownership statistics as of the November 13, 2026 close. Oracle and Amazon have no trailing price-to-FCF multiple because trailing free cash flow is negative.
Micron is the statistical outlier. Even after a 217.81% 52-week rally, it trades at 10.47 times trailing earnings and 4.41 times forward earnings, with a PEG ratio of 0.08 and a 14.93 price-to-FCF multiple. Those numbers are cheap only if the memory cycle holds; they are a trap if pricing rolls over from the peak that produced a 74.59% operating margin. NVIDIA, at 20.59 times trailing earnings and 13.46 times forward earnings, with a PEG of 0.27, is no longer priced as a scarcity object. The $3.93 trillion market cap still has to digest a leadership transition and the November 17 report, but the multiple itself is not the 2024-style argument.
Alphabet is the warning about trailing earnings. The 15.44 P/E looks like a bargain next to Microsoft’s 27.35. The forward multiple of 21.45, however, is higher than the trailing figure, and the price-to-FCF ratio is 184.14 because capex has compressed free cash flow to $19.75 billion. Amazon shows the same pattern: trailing P/E of 21.55, forward P/E of 26.97, and no FCF multiple at all. Cheap-looking AI stocks can be expensive once the income statement is translated into cash.
The rich end of the table is not subtle. AMD at 115.76 times trailing earnings, or 35.48 times forward, is a growth claim after a 106.29% 52-week run and an 8.75% down day. Palantir at 118.34 times trailing earnings, 73.10 times forward, and 55.54 times sales is a claim that agentic software can keep compounding from a $7.29 billion revenue base at a $404.77 billion valuation. Broadcom sits in between: a 44.29 trailing P/E that compresses to 19.94 forward, supported by a 42.04 P/FCF multiple and a 48.81% operating margin.
Institutional ownership is already high in several of these names — 79.66% at Broadcom, 79.55% at Micron, 75.80% at Microsoft, 75.34% at AMD — so crowding is part of the risk, not a footnote. That is why watching institutional and smart-money positioning is more useful than another generic “top AI stocks” list.
A low trailing P/E is not a margin of safety if free cash flow has been absorbed by capex, and a triple-digit multiple is not automatically a bubble if the cash economics are real. The multiple has to be read against the cash-conversion test.
What to watch next, and how to research the stack
The next hard test is NVIDIA’s fiscal third-quarter report on Tuesday, November 17, after the close, with the call at 2 p.m. Pacific Time. It will be the first earnings release under interim CEO Colette Kress, five days after the November 12 transition announcement. Investors will be looking for data-center growth, gross margin, customer concentration, export-policy language, and whether guidance still supports the demand that J.P. Morgan is embedding in its $900 billion 2026 capex path. Technical levels on the stock itself are the $148.80 November 12 low, the $204.19 200-day average, and the $214.65 50-day average.
The calendar then moves to the spenders and the other suppliers. Broadcom reports on December 9. Oracle is due the same day, by StockAnalysis’s estimate, which will test whether a 2.52 debt-to-equity ratio and negative free cash flow are being earned back by contracted cloud growth. Micron is estimated to report on December 16, the first real check on whether a 10.47 trailing earnings multiple is mid-cycle or late-cycle. Microsoft has already reported; the follow-through question is whether Azure’s 48% growth and the $677 billion backlog convert on time without another step-up in capex that compresses the 17.31% FCF margin further.
A practical research process starts with the layer, not the label. For infrastructure names, the questions are utilization, pricing, and how much of hyperscaler spend lands in revenue this year versus next. For platforms, the questions are remaining performance obligations, capex per dollar of incremental cloud revenue, and whether free cash flow is stabilizing. For agentic software, the questions are net new bookings, remaining performance obligations, and whether a 55% FCF margin can grow into a 70-times forward earnings multiple. Comparing those series side by side is the job of an AI investment research agent, not a one-line screen.
The risks cut across every layer. A slower capex cycle would hit NVIDIA, Broadcom, TSMC, and Micron on volume and hit Amazon, Oracle, and Alphabet on the return on assets they have already funded. A leadership or execution miss at NVIDIA would be a sector event, not a single-stock event. Memory pricing can fall as quickly as it rose. Export rules can change the customer mix overnight. And at the application layer, Palantir’s valuation leaves little room for a pause in the 87.1% trailing revenue growth that currently supports the shares.
None of that makes “AI stocks” a category to abandon or to buy as a bloc. It makes them a set of cash-flow statements that no longer move together. The November 13 close is simply the latest official tape on which to read that split — and the November 17 NVIDIA report is the next chance for the market to decide whether the suppliers or the spenders still have the better side of the trade.
FAQ
What are AI stocks?
AI stocks are the public companies that design, manufacture, power, host, or apply large-scale artificial intelligence. In late 2026 that universe is best read as a stack, not a single sector: infrastructure names such as NVIDIA, TSMC, Broadcom, Micron, and AMD; cloud platforms such as Microsoft, Alphabet, Amazon, Meta, and Oracle; and application or agentic software companies such as Palantir. The November 13, 2026 official closes show that those layers no longer trade as one group.
How did major AI stocks close on November 13, 2026?
U.S. cash markets were closed on the November 14–15 weekend, so the latest official prices are the November 13 closes. NVIDIA finished at $162.85, down 2.01% and 15.97% over 52 weeks. Microsoft closed at $523.88, Alphabet at $295.77, Amazon at $266.66, TSMC at $398.73, Broadcom at $347.01, and Meta at $641.69. Micron closed at $778.31, still up 217.81% over 52 weeks but 38% below its $1,255.00 high. AMD dropped 8.75% to $534.06. Palantir closed at $167.99, and Oracle at $125.35, down 44.78% over 52 weeks. The S&P 500 settled at 7,561.67, down 0.40%, and the Nasdaq Composite at 25,136.27, down 0.91%.
Are AI stocks in a bubble after the 2026 capex wave?
A single bubble label does not fit the tape. J.P. Morgan Global Research projects about $900 billion of AI capital expenditure in 2026 and a cumulative $5.5 trillion by 2030, and the cash-flow records already split the beneficiaries from the funders. NVIDIA generated $127.01 billion of trailing free cash flow on only $7.35 billion of capex. Broadcom and Micron also remain cash-rich. Amazon and Oracle posted trailing free cash flow of -$46.89 billion and -$28.72 billion after heavy capex, and Alphabet’s free cash flow margin is only 4.19%. Valuation is equally split: Micron trades at 10.47 times trailing earnings, NVIDIA at 20.59 times, while AMD and Palantir sit at 115.76 and 118.34 times trailing earnings.
Why can a cheap-looking AI stock still be expensive?
Because trailing earnings can look cheap while cash is being absorbed by capital expenditure. Alphabet’s 15.44 trailing P/E appears lower than Microsoft’s 27.35, but Alphabet’s forward P/E is higher, at 21.45, and its price-to-free-cash-flow ratio is 184.14 after $159.80 billion of trailing capex left only $19.75 billion of free cash flow. Amazon shows the same pattern, with a 21.55 trailing P/E, a 26.97 forward P/E, and no trailing P/FCF multiple because free cash flow is negative. The useful check is cash conversion, not the headline earnings multiple alone.
What should investors watch next for AI stocks?
The next hard test is NVIDIA’s fiscal third-quarter report on Tuesday, November 17, 2026, after the close, the first earnings release under interim CEO Colette Kress after Jensen Huang’s November 12 resignation. Broadcom reports on December 9, Oracle is estimated to report the same day, and Micron is estimated to report on December 16. For platforms, the follow-through question is whether Microsoft’s 48% Azure growth and $677 billion commercial remaining performance obligation convert without another capex step-up that compresses free cash flow. Across the stack, the risks to watch are a slower capex cycle, memory pricing, export-policy changes, and whether expensive software multiples can keep compounding.